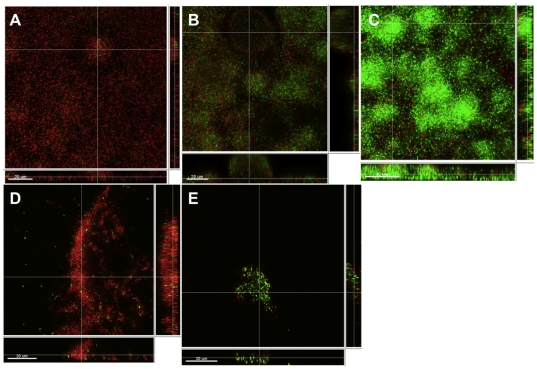
Figure 3. Antibiotic tolerance of maturing flow-cell biofilms of P. aeruginosa and aggregates harvested from a static P. aeruginosa culture.
Biofilms and aggregates were grown for 24 h to 72-h prior to tobramycin (100 ug/ml) treatment for 24-h. For visualization by CLSM a GFP-tagged PAO1 strain (green) was used and stained with the DNA stain PI (red) for visualizing dead bacteria. Panels A, B and C represent biofilm tolerance on day 1, 2 and 3 respectively andpanels D and E are aggregates on day 1 and 2. Length of size bars: 20 µm.

