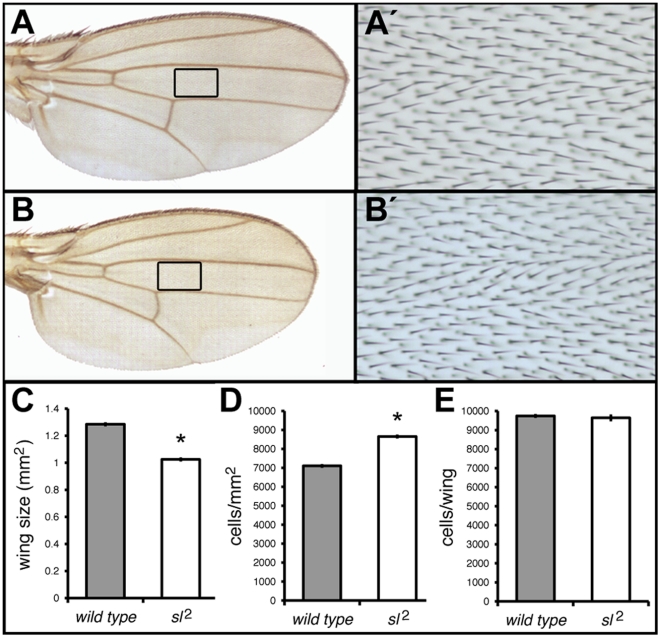
Figure 1. Wing phenotype of sl 2 mutants compared to ORR (Oregon R) controls.
Only male flies were used in this and subsequent figures unless otherwise noted. (A) Wild type wing. (A') shows a higher magnification of boxed area in (A), illustrating the wing region used to determine cell density. (B) sl 2 mutant wing. (B') shows an amplification of boxed area in (B), used to determine cell density. (C) Histogram showing the reduced mutant sl 2 wings area. n = 100. (D) Histogram showing an increase in cell density in sl mutant wings. n = 100. (E) Histogram showing the averages of total number of cells of complete wing surfaces. n = 5. sl 2 and ORR do not differ significantly. *p<0.001; error bars represent SEM.

