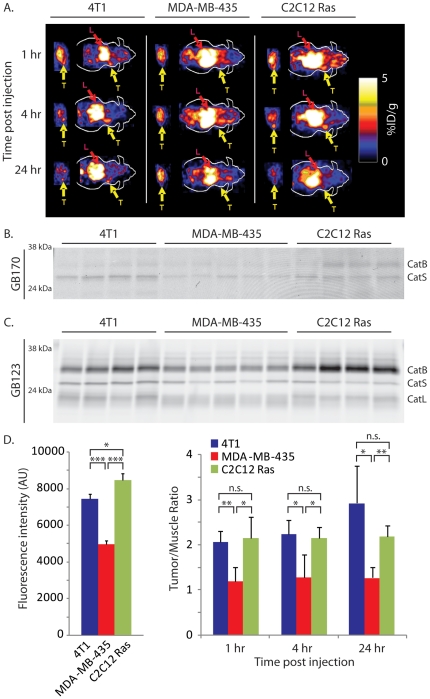
Figure 5. Probe signals in tumors correlate with levels of active cathepsins.
(A) Representative coronal and transaxial decay corrected microPET images of athymic nude mice bearing 4T1, MDA-MB-435 and C2C12/Ras tumors at different time points after tail vein injection of (1.85 MBq, 50 µCi) 64Cu-GB170. Locations of tumors (T) and liver (L) are indicated. (B) SDS-PAGE and fluorescence scanning of tumor lysates from mice in (A) after the final 24 hr time point. The positions of fluorescently labeled cathepsins are indicated. (C) Determination of residual cathepsin activity in tumors from mice in (A) as measured by labeling of lysates with GB123 followed by SDS-PAGE and scanning of the gel with a flatbed laser scanner. (D) Comparison of the levels of probe levels in tumor relative to muscle as measured by PET (right bar graph) to the levels of active cathepsins as measured by quantification of gels in (C; left bar graph). The p-values are indicated and defined as follows: n.s. = not significant, *<0.05, **<0.01, ***<0.001.

