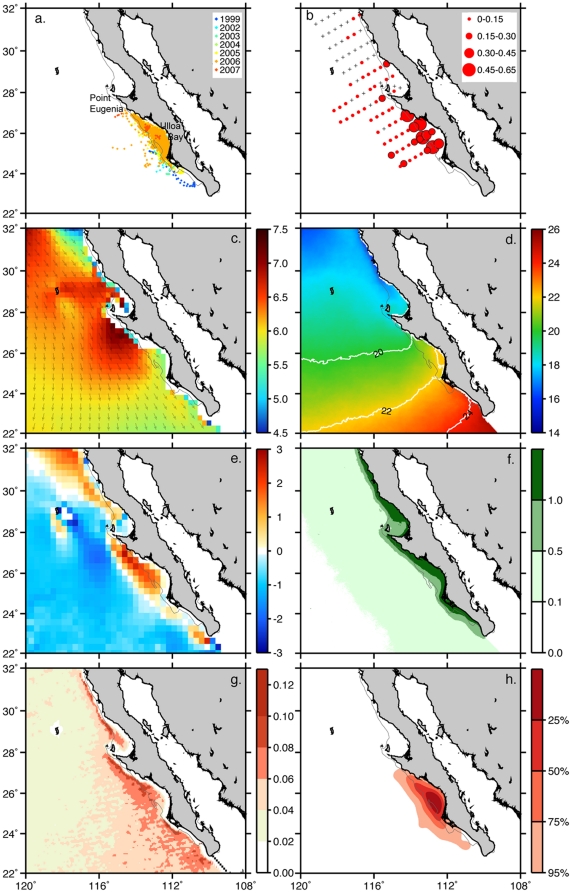
Figure 1. Spatio-temporal data averages off the Pacific coast of Baja California Sur, Mexico.
Figure panels include: (A) Juvenile loggerhead turtle tracks (1999–2007; n = 30), (B) mean red crab abundance (log num m−3) at each IMECOCAL cruise station (2000–2008). Long-term averages of (C) surface winds (m s−1), (D) sea-surface temperature (°C), (E) vertical Ekman velocity (dm day−1), (F) chlorophyll-a (mg m−3), (G) frontal probability, (H) loggerhead turtle utilization distribution (%). Thin gray line represents the 200-m isobath.

