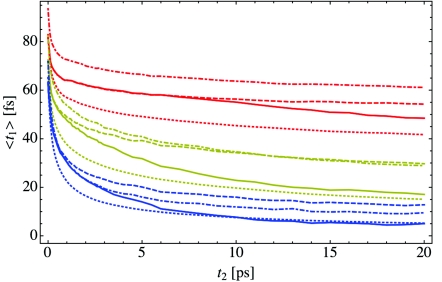
Figure 5.
The first moment of the vibrational echo intensity, 〈t1〉, for X = 2 (red), 6 (yellow), and 16 (blue) within various approximations. The solid curve is the full calculation, Eq. 15, while the dashed curve does not include vibrational lifetime effects. The dotted-dashed and dotted curves are the spectra within the Condon and cumulant approximations, respectively.

