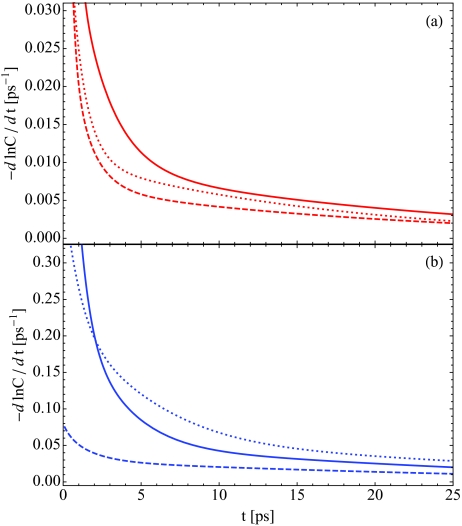
Figure 9.
The negative time derivative of the natural logarithm of the frequency-fluctuation autocorrelation function Cω(t), Eq. 8 (solid), the population fluctuation autocorrelation function Cn(t), Eq. 19 (dashed), and the second Legendre polynomial of molecular rotations C2(t), Eq. 13 (dotted). The low hydration, X = 2, case is shown in red in panel (a), while the X = 16 case is in blue in panel (b).

