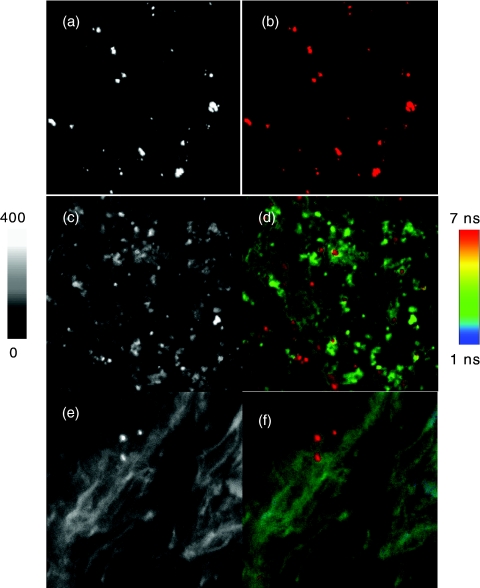
Figure 3.
Representative images of tissue specimens prior to staining in (a) intensity and (b) lifetime and those after staining in (c) intensity and lifetime (d) images. The tissue specimens were stained with 1,2-dihexadecanoyl-sn-glycero-3-phosphoethanolamine triethyl ammonium salt on the cell membranes and YOYO-1 iodide on the nucleus. The scales of images are 50×50 μm and the resolutions are 500×500 pixel with an integration of 0.6 ms/pixel. The tissues without biotinylation treatments were also incubated with the avidin-FMN complexes and the images in (e) intensity and (f) lifetime were collected as controls.

