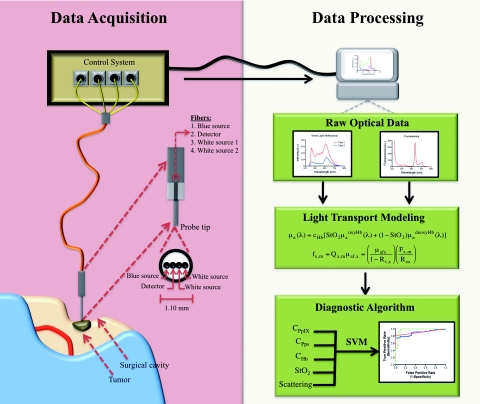
Figure 1.
Conceptual diagram of the probe measurements and data analysis. Data Acquisition (left): The intraoperative fiber optic probe with a tip diameter of ∼1.1 mm is gently placed on the clean tissue surface. Sequential interrogation with white and blue light allows collection of diffuse reflectance and fluorescence spectra using a spectrometer (<0.5 s). Data Analysis: White-light reflectance data are input to a spectrally-constrained optical model to calculate the tissue optical absorption and scattering at each wavelength. These are used to correct the measured fluorescence spectrum for variations in tissue optical properties and to generate the quantitative fluorescence spectrum from which the fluorophore concentrations can be calculated (∼1 s). The calculated biomarker values (e.g., cPpIX, cPps, and cHb) are used in a SVM-based diagnostic algorithm to classify interrogated regions as normal tissue or tumor.

