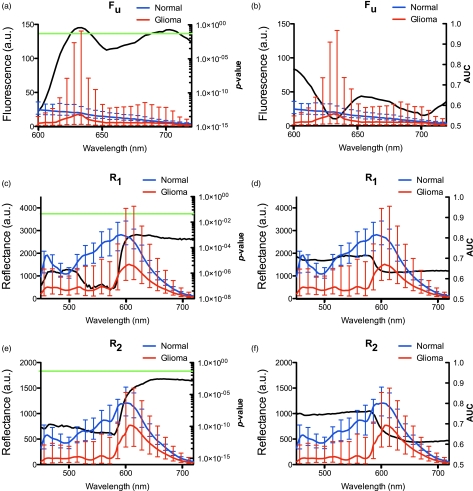
Figure 2.
Raw fluorescence and reflectance spectra. The median spectra for each of Fu(λ) (A,B), R1(λ) (C,D), and R2(λ) (E,F) were calculated for normal (blue line) and tumor (red line) tissue. Error bars represent the interquartile range. P-values from the Wilcoxon-rank sum analysis are indicated by the black line, left column, with the green horizontal line crossing at P = 0.05. Associated AUC values are shown as the black line, right column. (Color online only.)

