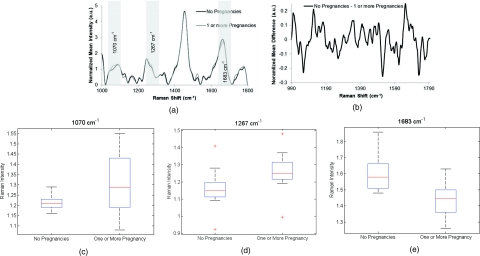
Figure 3.
(a) Normalized average Raman spectra from patients with zero pregnancies and one or more pregnancy. Highlighted regions are displayed in (c–e). (b) Difference spectra between measurements from patients with and without previous pregnancy. (c–e) Box plots showing regions of difference between patients with and without previous pregnancy. Potential peak assignments: (c) collagen/elastin, (d) Amide III, (e) C–O stretch. The box contains data between the 25th and 75th percentile, with the centerline representing the median. The error bars are ±1 S.D. about the mean. Outliers are represented by +.

