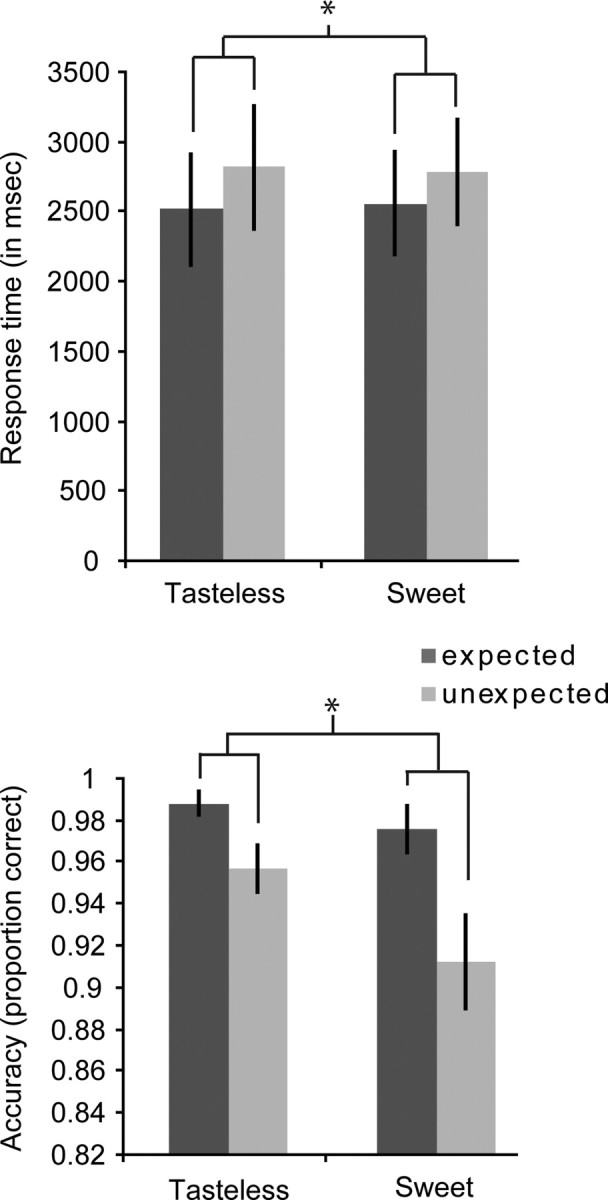
Figure 3.

Response times and proportion correct responses of the four different events of interest. We plotted response times (in milliseconds) and proportion correct responses, respectively (averaged over subjects, ±SEM), against stimulus (x-axis). Dark gray bars, Expected events; light gray bars, unexpected events. Expected events were responded to faster and more accurately (*p < 0.05).
