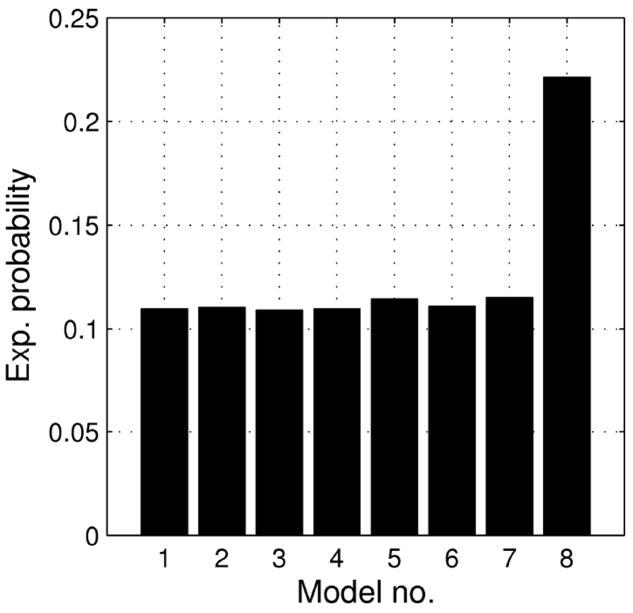
Figure 7.
Expected posterior probabilities of models from the first class for slow learners. The distribution is similar to the one of the control group and distinctively different from the one of the patient group. Model numbers are drawn from Table 1.

