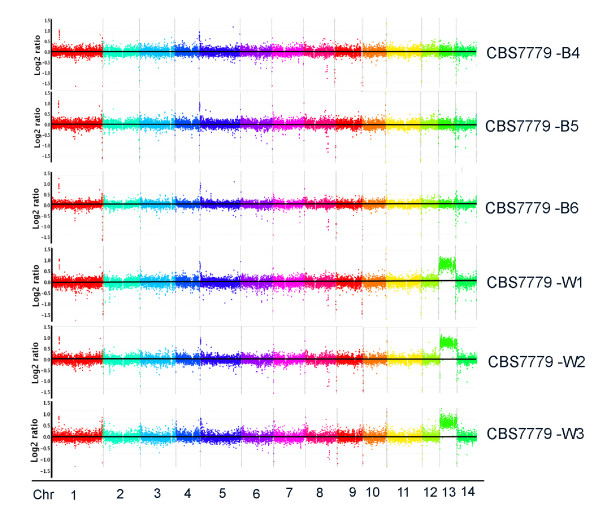
Figure 1.
Comparative genome hybridization reveals disomy for chr 13 in melanin variants. A custom CGH array (Roche-NimbleGen) for the reference genome of strain H99 was used to examine the black (CBS7779-B4, CBS7779-B5 and CBS7779-B6) and white (CBS7779-W1, CBS7779-W2 and CBS7779-W3). The x-axis represents the position of probes arranged in the order of their chromosomal location. The y-axis denotes the relative hybridization signal intensity that was plotted as the log2 value. Each spot represented a running average value of hybridizations for a genomic segment of 1,300 bps across the chromosomes. All three white strains showed disomy on chromosome 13.

