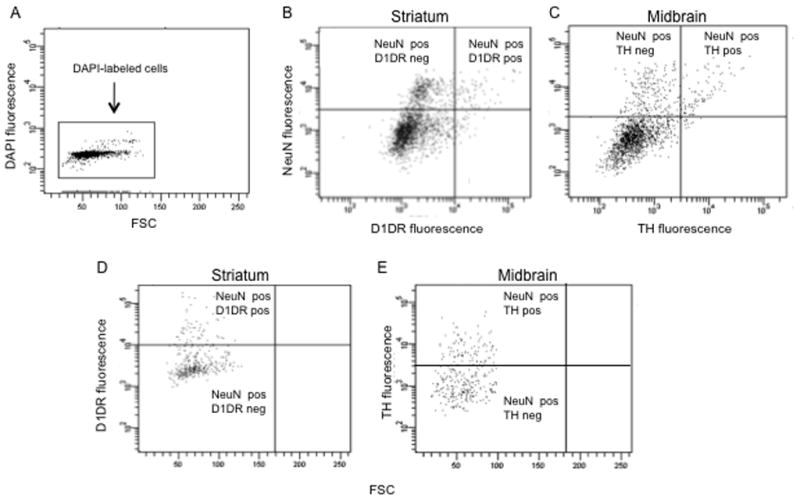
Figure 5.

Flow cytometry of striatal cells labeled with D1R and midbrain neurons labeled with TH. (a) A forward light scatter (FSC) vs. fluorescence plot of DAPI fluorescence. Each dot represents one event or one cell. The y-axis measures fluorescence intensity in the DAPI channel. Only events positive for DAPI were used for further FACS analysis. (b) Fluorescence plot of striatal cells colabeled with NeuN and D1R antibodies. (c) Fluorescence plot showing midbrain cells labeled with NeuN and TH antibodies. Quadrant boundaries were determined by thresholds for non-specific labeling using fluorescent labels alone (without primary antibody). Note the top left and top right quadrants, which identify (b) D1R-negative and D1R-positive neurons, respectively and (c) TH-negative and TH-positive neurons, respectively. (d) and (e) Forward scatter (FSC) vs. fluorescence plots showing (d) striatal D1R and (e) midbrain TH labeling of only NeuN-labeled neurons (PE-positive events). These graphs are forward gated so that all events on these plots are NeuN-positive. Note distinct clusters of D1R or TH-labeled events above and below the respective labeling thresholds.
