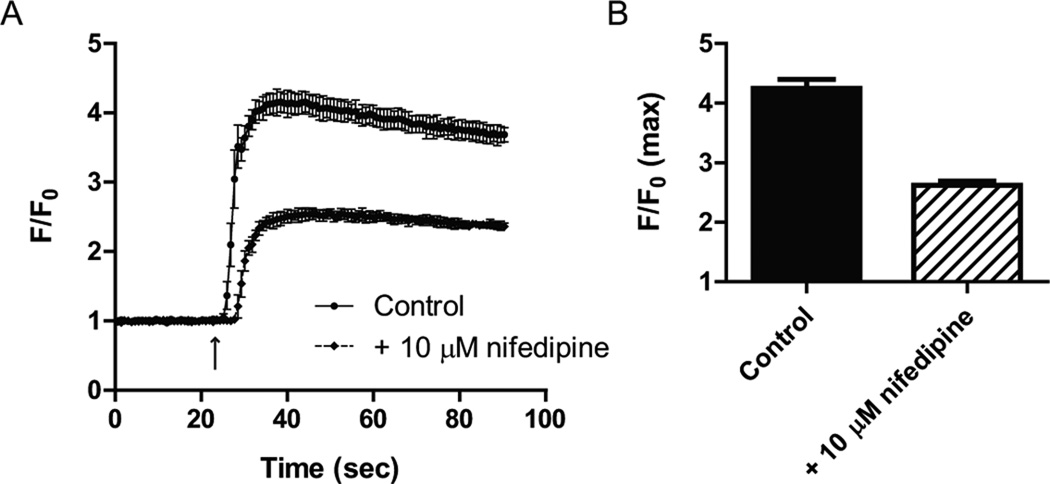
Figure 2. Ca2+ mobilization assays in 96-well plate format using primary cultured cortical neurons.
(A) Depolarization of primary cultured neurons with 100 mM KCl (stimulus indicated by arrow) increases the intracellular Ca2+ concentration 4.45-fold. Data from three separate neuronal cultures is shown as mean ± s.e.m. and as ratio (F/F0) of the relative fluorescence (F) and normalized background fluorescence (F0). (B) Absolute RFU values obtained for the experiment shown in (A) were 33 ± 3 for background and 145 ± 17 for the maximal response (n=3, P<0.01). Data is shown as mean ± s.e.m. ** P<0.01. (C) Representative experiment showing the effect of the Ca2+ channel blocker nifedipine on the intracellular Ca2+ concentration, to highlight experimental variability. Data is shown as mean ± s.d. The arrow indicated KCl stimulus. (D) Nifedipine reduces the maximal response (F/F0 max) by 38%. Data is shown as mean ± s.d.

