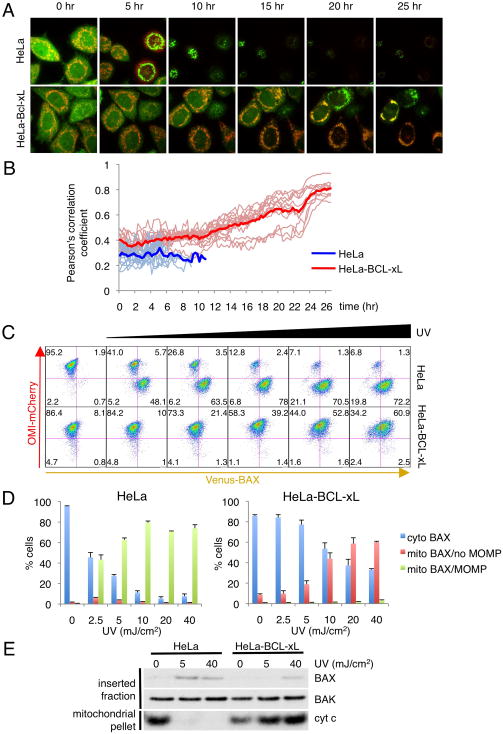
Figure 6. In the presence of BCL-xL, activated BAX translocates to the mitochondria without inducing MOMP.
(A) HeLa cells stably expressing Venus-BAX and Omi-mCherry in the presence or absence of over-expressed BCL-xL, were exposed to 40 mJ/cm2 UV plus Q-VD-OPH (20 nM) and imaged by live-cell confocal microscopy. Representative confocal micrographs are shown with the time of each frame relative to the time of stimulation. See also Movies S1 and S2. (B) To quantify BAX translocation in the absence of MOMP, co-localization between Venus-BAX and Omi-mCherry was measured by Pearson’s correlation coefficient. Heavy lines represent the average of 15 individual cells (light lines) for each condition. Measurements were stopped when individual cells underwent MOMP. (C) HeLa cells stably expressing Venus-BAX and Omi-mCherry in the presence or absence of over-expressed BCL-xL, were exposed to 0, 2.5, 5, 10, 20 and 40 mJ/cm2 UV in the presence of Q-VD-OPH (20 nM) for 30 hr. Cells were permeabilized with digitonin (200 μg/ml) and analyzed by flow cytometry. Representative dot plots are presented. (D) The percentage of cells representing mCherryhigh/Venuslow (cyto BAX), mCherryhigh/Venushigh (mito BAX/no MOMP) and mCherrylow/Venushigh (mito BAX/MOMP) groups is shown for HeLa cells (upper graph) and HeLa-BCL-xL cells (lower graph). Error bars represent standard deviation from triplicate data. (E) HeLa cells stably over-expressing BCL-xL or empty vector were exposed to 0, 5 or 40 mJ/cm2 UV in presence of Q-VD-OPH (20 nM). After 30 hr, MHM fractions were extracted from the cells and analyzed by Western blot for cytochome c (mitochondrial pellet) or subjected to carbonate extraction and analyzed by Western blot for BAX and BAK (inserted fraction).
(See also Figure S4)

