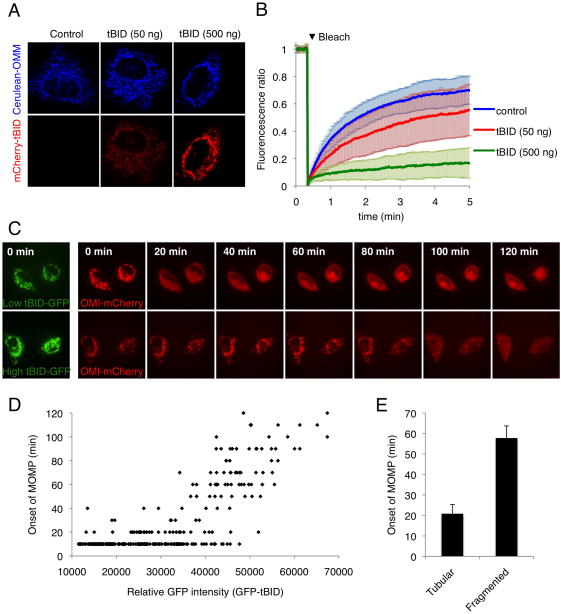
Figure 7. MODE 2 sequestration promotes mitochondrial fragmentation and affects the kinetics of MOMP upon de-repression.
(A) HeLa cells stably expressing Cerulean-OMM (Cerulean protein targeted to the outer mitochondrial membrane by fusion to the C-terminal region of BCL-xL) and over-expressing BCL-xL were transfected with the indicated concentrations of mCherry-tBID plasmid for 30 hr. Representative confocal micrographs are shown. (B) Mitochondrial fragmentation was monitored by fluorescence recovery after photobleaching (FRAP) of the Cerulean-OMM. Each line of the graph is an average of 30 individual cells, error bars represent standard deviation. (C) HeLa cells expressing Omi-mCherry and over-expressing BCL-xL were transfected with GFP-tBID and treated after 30 hr with ABT-737 (20 μM) plus Q-VD-OPH (20 μM) and imaged every 10 min by live-cell confocal microscopy. Representative confocal micrographs are shown. The time of each frame relative to the time of ABT-737 addition is shown. (D) Cells were treated as in (C). GFP-tBID levels preceding ABT-737 treatment in individual cells were quantified by measuring the mean GFP signal intensity. Time of onset to MOMP was determined by monitoring Omi-mCherry release and was plotted as a function of GFP-tBID intensity. The graph represents the analysis of 300 individual cells from three independent experiments (E) Cells were treated as in (C); prior to ABT-737 treatment cells were scored for mitochondrial morphology (tubular vs. fragmented) and onset of MOMP was monitored as in (D). Error bars represent standard deviation from triplicate data.
(See also Figure S5)

