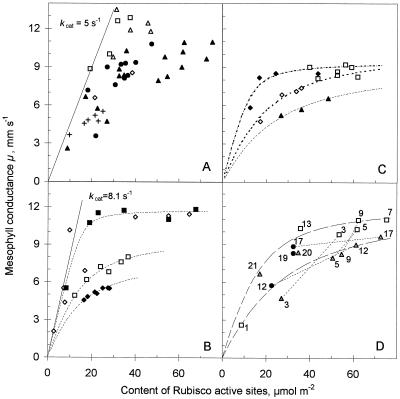
Figure 1.
Relationships between Et and μ in leaves. A, Influence of growth conditions. •, High-light-grown, commercially fertilized sunflower, different-aged leaves; ▴, high-light-grown sunflower, increased-N treatment, different-aged leaves; ⋄, 25 mg g−1 KH2PO4 kg−1 soil; ▵, 140 mg g−1 KH2PO4 kg−1 soil; □, 250 mg g−1 KH2PO4 kg−1 soil (plants grown in a greenhouse in May–June); ×, low-light-grown sunflower. Line corresponds to kcat of 5 s−1 per Rubisco active site. B, Adaptation to different light intensities. ♦, 2.5-week-old, low-light-grown plants; ⋄, low-light-grown plants adapted at high-light intensity for 2 weeks; ▪, 2-week-old, high-light-grown plants; □, high-light-grown plants adapted 2 weeks at low-light intensity. Line corresponds to kcat 8.1 s−1 per Rubisco active site. C, Different-aged leaves of different species. ♦, Cotton; ⋄, bean; □, potato; ▴, English spinach. D, Changes over the life span of single leaves. □, Different leaves of a 2-week-old plant; , 3.5-week-old plant; •, 5.5-week-old plant. Numbers at the points correspond to the plant leaf, numbered upward, not counting cotyledons and juvenile leaves. Dotted lines indicate changes in the same leaf. C and D, Data from Eichelmann and Laisk (1990).

