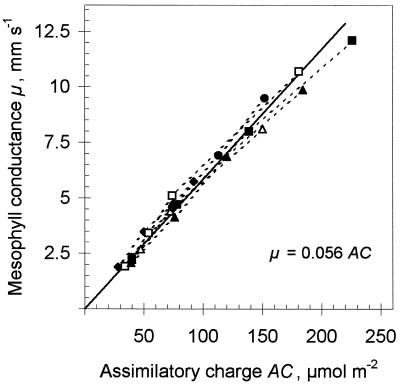
Figure 3.
Relationship between μ and AC for five different-aged leaves of one plant. Different assimilatory charges were generated by decreasing light intensity from 1300 μmol m−2 s−1 to different levels for 10 s, and then μ and AC were measured at a Cw0 of 3.25 μm. SCE was 0.056 mm s−1 μmol−1 m2 (the slope of the solid line).

