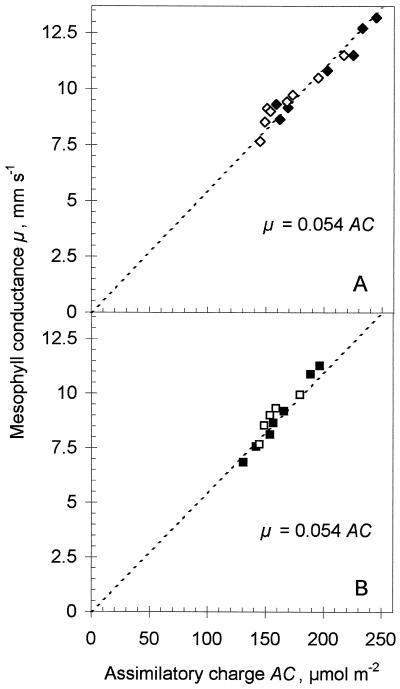
Figure 4.
Relationships between μ and AC obtained by varying the Pi concentration in the cytosol by feeding Pi or Man through the petiole. A, Feeding 10 mm Man for 110 min (♦) and reversing the experiment in distilled water for 125 min (⋄). B, Feeding 33 mm Pi for 190 min (▪) and reversing the experiment in distilled water for 120 min (□). The slope of the dashed lines corresponds to a SCE of 0.054 mm s−1 μmol−1 m2.

