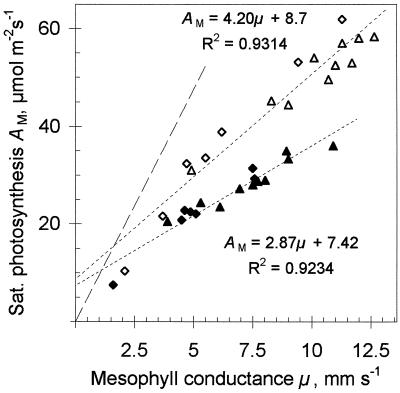
Figure 6.
AM as a function of μ in sunflower leaves adapted to different light intensities. ♦, 2.5-week-old low-light-grown plant; ⋄, low-light-grown plant adapted 2 weeks at high light intensity; ▵, 2-week-old high-light-grown plant; ▴, high-light-grown plants adapted for 2 weeks at low light intensity. Dotted lines are regression lines; dashed line corresponds to VM of Rubisco calculated from the μ assuming the Michaelis-Menten kinetics.

