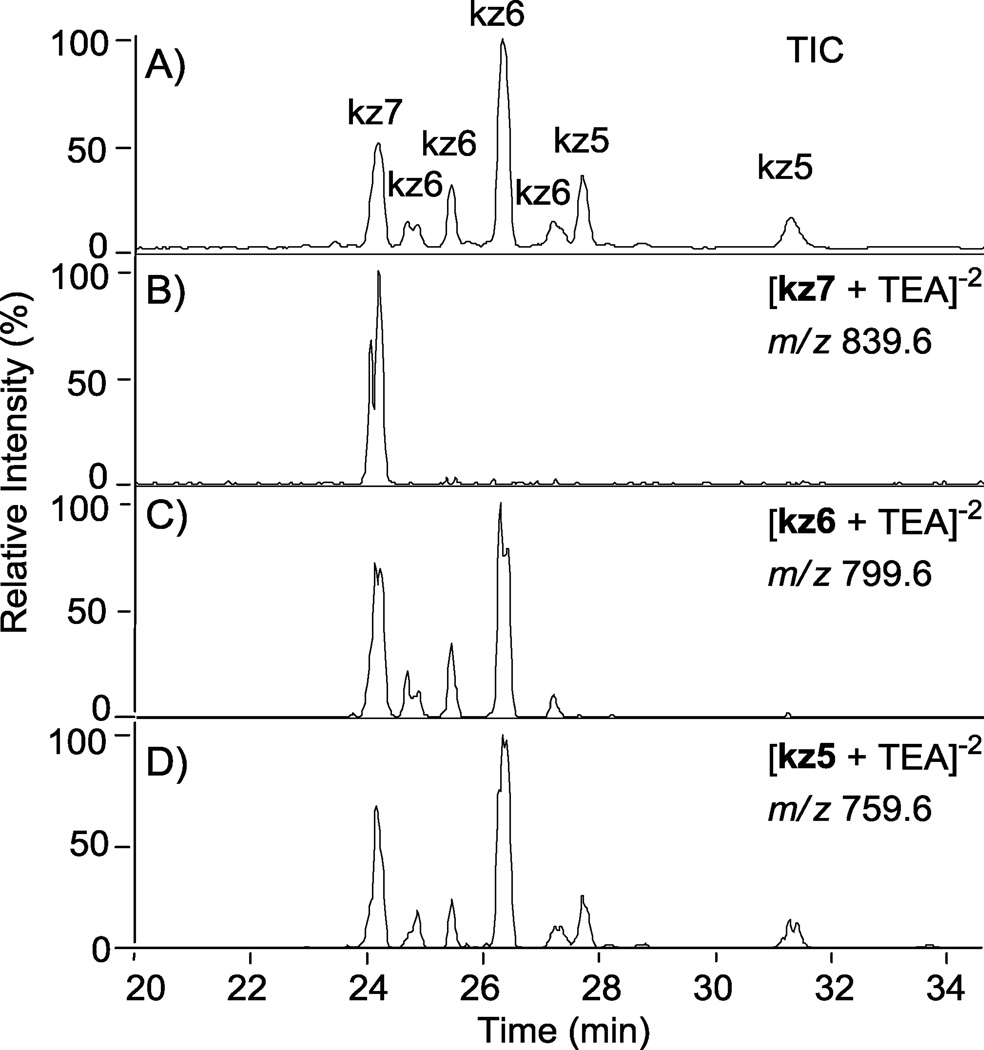
Figure 4.
Separation of N-cbz O-sulfonated kanamycin derivatives that differ by degree of sulfation and the position of sulfate groups using RPIP-HPLC interfaced with an ESI- ion trap mass analyzer. Peaks for all sulfonation products are shown in the total ion chromatogram (TIC, A). The extracted ion chromatograms (B–D) were extracted based on m/z ratios that fall within the range predicted for a degree of sulfation (5, 6, or 7 sulfate groups); see Table 1 for an example of predicted m/z ratios. Ion chromatograms were extracted from the TIC for the indicated degrees of sulfation (DS): (B) persulfated, DS = 7, kz7; (C) DS = 6, kz6; (D) DS =5, kz5.

