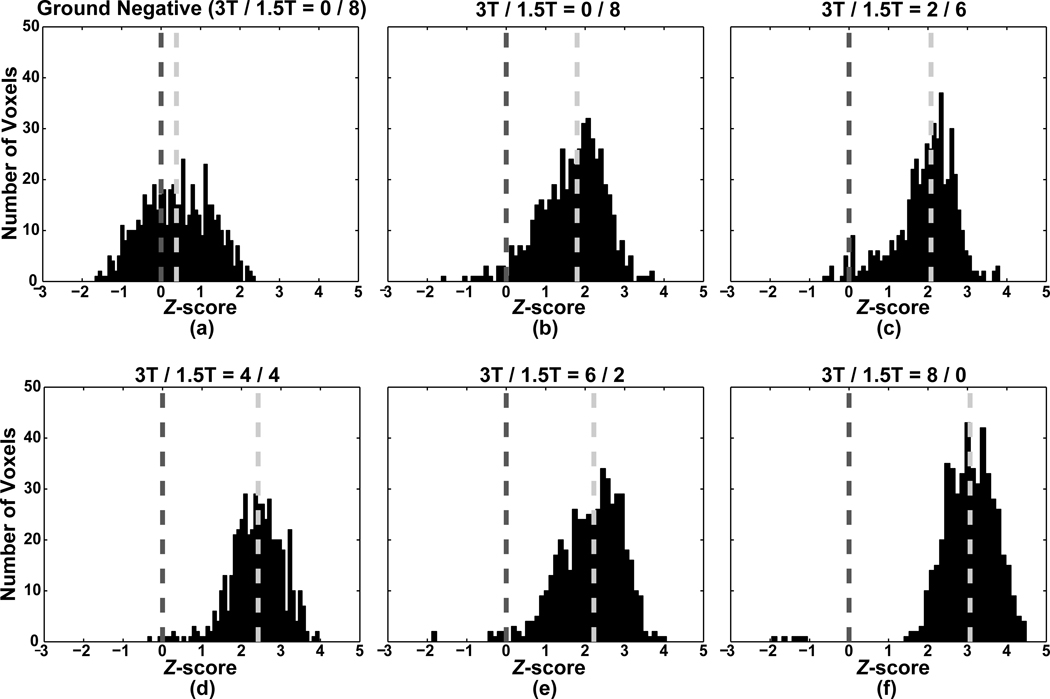
Figure 5.
(a) Plot of Z-score distribution in the converse of the assumed gold standard (i.e., ground negative) region for the 0/8 mixing combination (i.e., 1.5T-only). (b)–(f) Plots of Z-score distributions in the assumed gold standard region for the five mixing combinations (3T/1.5T: 0/8, 2/6, 4/4, 6/2, 8/0). The light gray vertical dotted line indicates the median of each Z-score distribution and the dark gray vertical dotted line indicates Z = 0.

