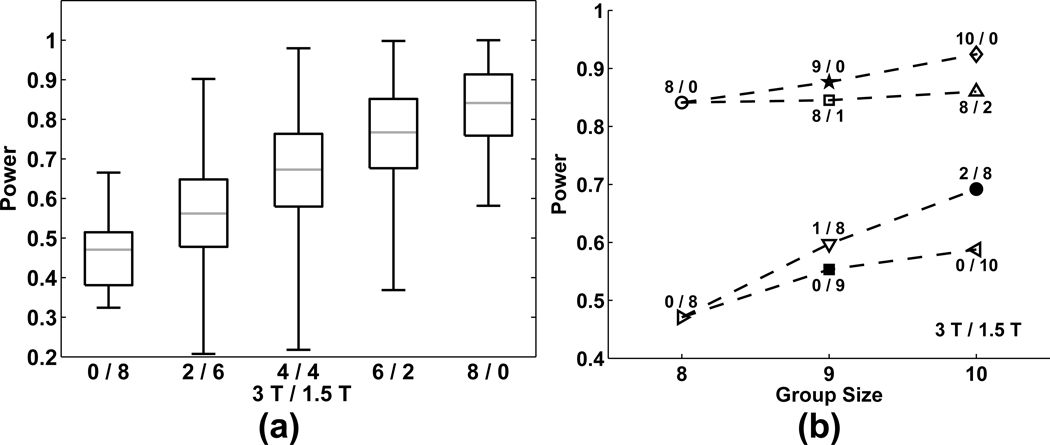
Figure 6.
(a) Box and whisker plots of power (assessed by true positive rate, TPR, for α = 0.05, uncorrected) across the five mixing combinations (3T/1.5T: 0/8, 2/6, 4/4, 6/2, 8/0). (b) Plot of average power as a function of main data collection group exhibiting the median TPR, after inclusion of 0–2 additional subjects (either field strength).

