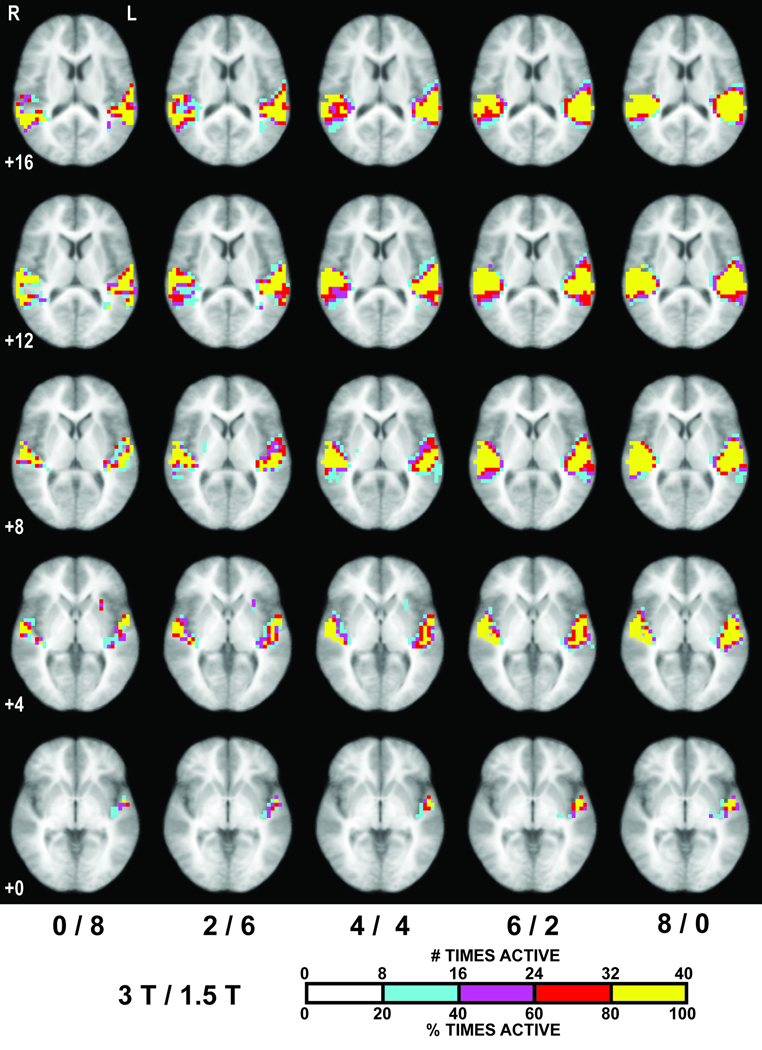
Figure 8.
Maps of probability activation overlap across the 40 selected subject combinations for each mixing combination, indicating the number of subject combinations in which a given voxel met Z > 1.96 (p < 0.05, uncorrected). Voxels active at least 20%, 40%, 60% and 80% of the combinations are colored cyan, purple, red and yellow, respectively. Images are at the same Talairach z-coordinates as in Fig. 4.

