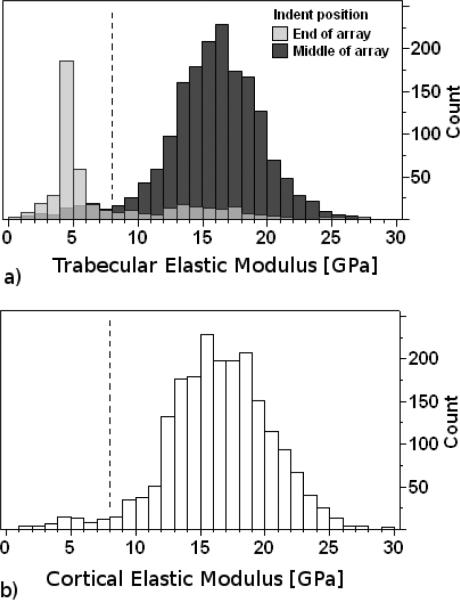
Fig. 3.
Histograms of elastic modulus values for all indents made in trabecular (a) and cortical (b) bone regions. Some mechanical property data from the thin edges of sectioned bone and from plastic entered into the data set as a result of the intention to indent across regions of bone tissue by starting and ending in the plastic region (Fig. 2). When the initial and final indents of each linear array were removed from the data set, the peak centered at the low modulus region (4 to 5 GPa) was greatly reduced (a; dark grey bars). In addition to indentations made in the plastic regions, other low modulus values were likely from indentations in lacunae and cracks (a; light grey bars). Low modulus values were indistinguishable from the modulus of the embedding material (4.15 and 2.02 GPa for HFH and SMC biopsies, respectively), thus these values were filtered out of the data set. Medium gray areas (a) show the overlapping regions of the 2 distributions. Data below 8 GPa (dotted black line) were eliminated from the analysis. Cortical bone indents below 8 GPa were not included in the analysis of cortical bone properties (b).

