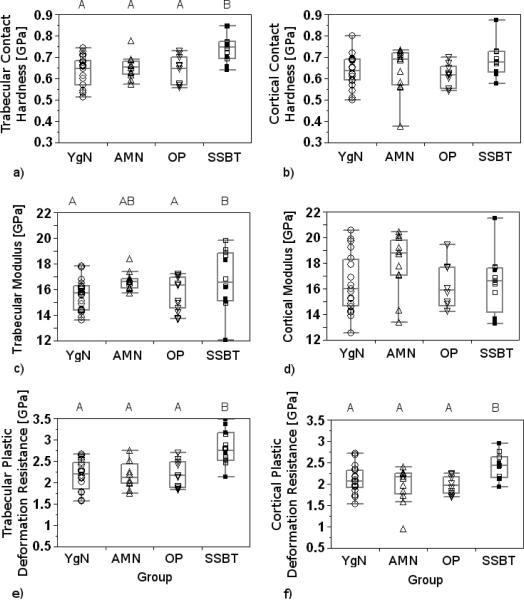
Fig. 5.
Box plots of contact hardnesses (a, b), elastic moduli (c, d), and plastic deformation resistances (e, f) of trabecular (a, c, e) and cortical bone (b, d, f) averaged by biopsy and reported by Group (YgN=Young Normals, AMN=Age-Matched Normals, OP=Osteoporotic, SSBT=Severely Suppressed Bone Turnover). Biopsies from Southwestern Medical Center (SMC) are represented by filled squares (■). All other biopsies were from Henry Ford Hospital (HFH). Groups with significantly different mechanical properties, when both SMC and HFH biopsies were included in the analysis, are denoted with different letters (Tukey post hoc tests). Significance level for all tests was α=0.05.

