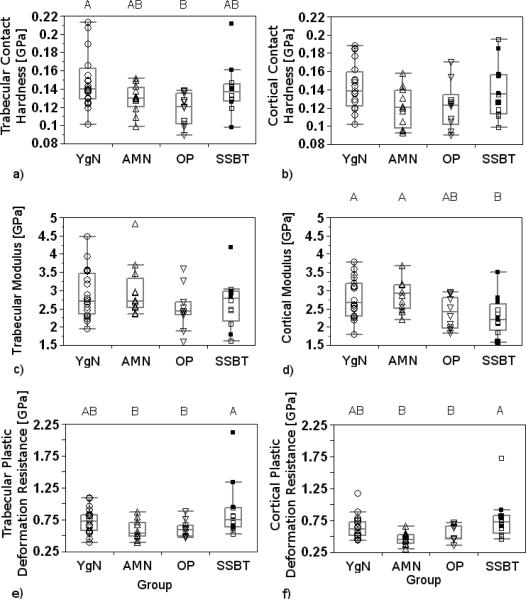
Fig. 6.
The average standard deviations of trabecular contact hardness (a), trabecular plastic deformation resistance (e), cortical modulus (d), and cortical plastic deformation (f) were significantly different among the four groups (ANOVA, p=0.012, p=0.015, p=0.011, p=0.003, respectively). Significance level for all tests was α=0.05. Groups with significantly different within-individual variability in properties are denoted with different letters (Tukey's HSD).

