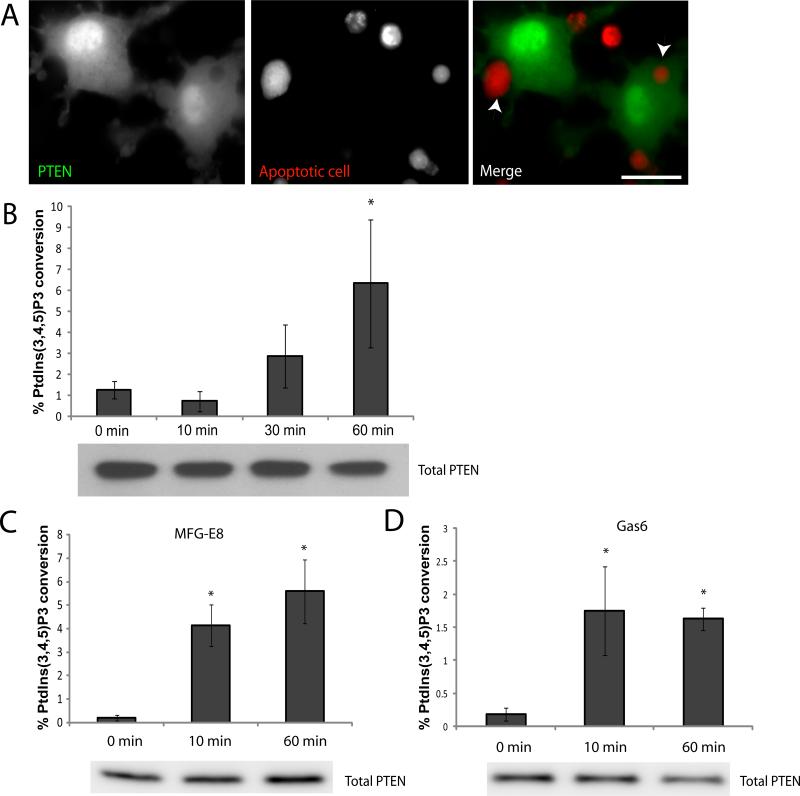
Figure 2. PTEN activity is elevated during efferocytosis.
(A) Subcellular localization of PTEN during efferocytosis. RAW264.7 cells transfected with a PTEN-citrine construct were incubated with SNARF1 labeled apoptotic thymocytes for 60 min. Cells were washed, fixed and analyzed by fluorescence microscopy. Bar represents 10 μm. (B) PTEN activity during engulfment of apoptotic cells. Peritoneal macrophages were incubated with apoptotic thymocytes for indicated time and washed to remove unadhered thymocytes. Cells were then lysed and PTEN was immunoprecipitated. PTEN activity was assessed by its ability to convert PtdIns(3,4,5)P3 to PtdIns(4,5)P2 and free phosphate. Free phosphates generated were measured by a colorimetric assay using malachite green. Data is a representative of 3 independent experiments done in triplicates. Results shown are means ± SD. * p<0.05. (C) PTEN activity in macrophages stimulated with MFG-E8. Wild type and PTEN-/- macrophages were stimulated with 1μg/ml MFG-E8 for indicated time points and PTEN activity was assessed as described above. Results shown are means ± SD. * p<0.05. (D) PTEN activity in macrophages stimulated with Gas6. Wild type and PTEN-/- macrophages were stimulated with 1μg/ml Gas6 for indicated time points and PTEN activity was assessed as described above. Results shown are means ± SD. * p<0.05.

