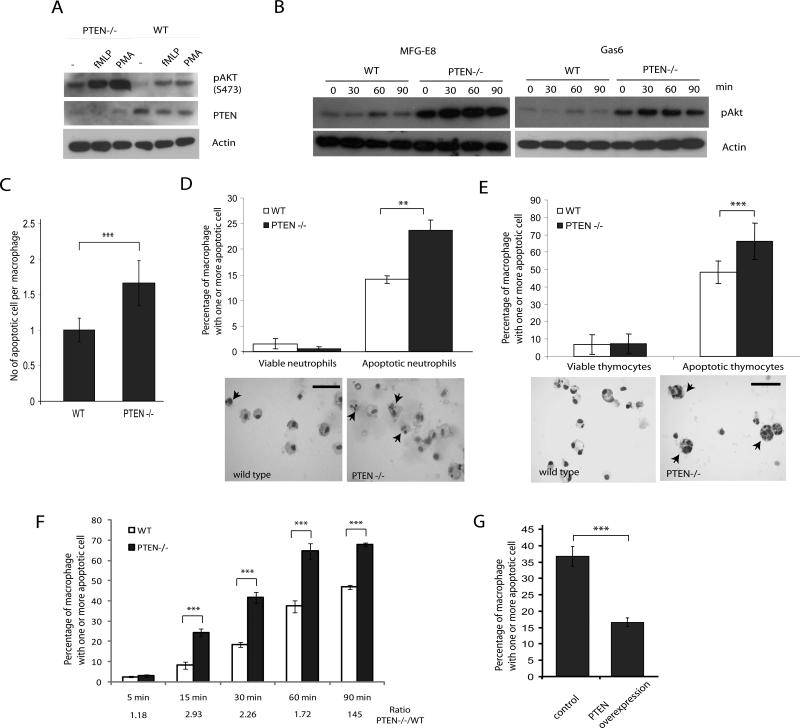
Figure 3. Loss of PTEN leads to enhanced efferocytosis in vitro.
(A) Loss of PTEN in macrophages led to increased Akt phosphorylation. Thioglycollate-elicited peritoneal macrophages from wild type or PTEN-/- mice were stimulated with 1 μM fMLP or 100 nM PMA for 30 min. Cell lysates were analyzed by western blotting with phosphor-Akt (Ser473), PTEN and Actin antibodies. (B) Wild type and PTEN-/- macrophages were stimulated with 1μg/ml MFG-E8 or 1μg/ml Gas6 for indicated time points and cell lysates were analyzed for phospho-Akt. Actin is used as a loading control. (C) Wild type or PTEN-/- peritoneal macrophages were incubated with apoptotic cells at a density of (1:10) for 90 minutes at 37°C. Cells were washed and efferocytosis was analyzed by HEMA3 staining. Number of apoptotic cells per macrophage was counted and represented as efferocytic index, n>600. (D-E) Wild type or PTEN-/- peritoneal macrophages were incubated with fresh or one-day cultured bone marrow neutrophils (D), or viable or dexamethasone-induced apoptotic thymocytes (E) at a density of (1:10) for 90 minutes at 37°C. Cells were washed and efferocytosis was analyzed by HEMA3 staining. Number of macrophages containing one or more apoptotic cell was scored as % efferocytosis. Arrowheads indicate macrophage containing engulfed apoptotic cells. Bar represents 50μm. (F) Wild type and PTEN-/- macrophages were incubated with apoptotic thymocytes for indicated time points and engulfment of apoptotic cells was analyzed by HEMA3 staining. Ratio of percentage of macrophages with one or more apoptotic cells between PTEN-/- and wild type macrophages is depicted. (G) RAW264.7 cells were transfected with a PTEN-citrine construct or pMax-GFP (control) and incubated with apoptotic cells. Cells that expressed fluorescent proteins were then scored and their ability to engulf apoptotic cells was measured as described above. Results shown are mean ± SD (n>600). **p<0.01, ***p<0.005.

