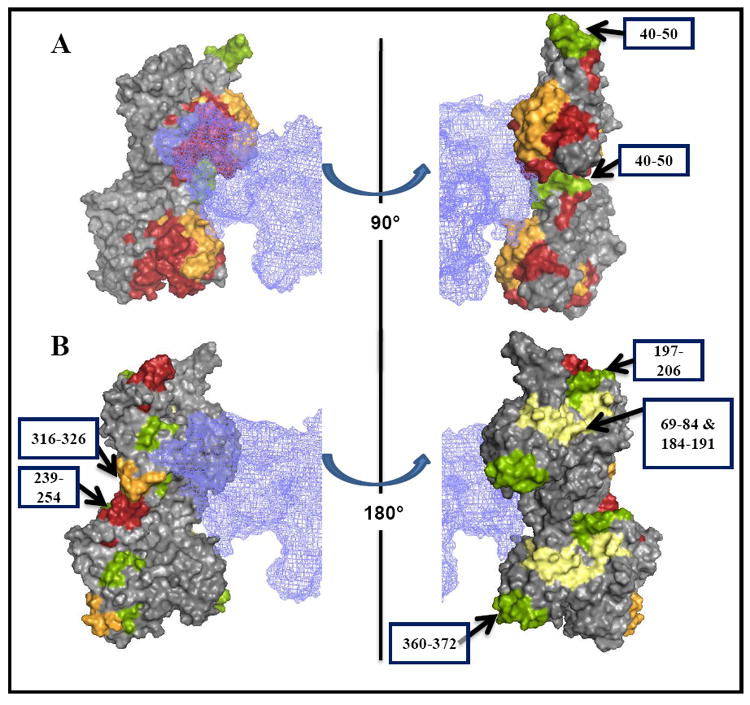
Figure 3.

Comparison of radiolytic footprinting data with the acto-S1 model of Lorenz and Holmes (2010) 14 identifies actin segments affected allosterically by S1. S1 protection of actin from oxidation is shown on a surface of actin dimer using the same color code for protection levels as in Figure 1. Myosin S1 is represented by a blue meshwork. Actin peptides involved in direct interactions with S1 are highlighted in (A). The arrows (B) point to the regions of actin that are most likely affected allostericaly by myosin binding.
