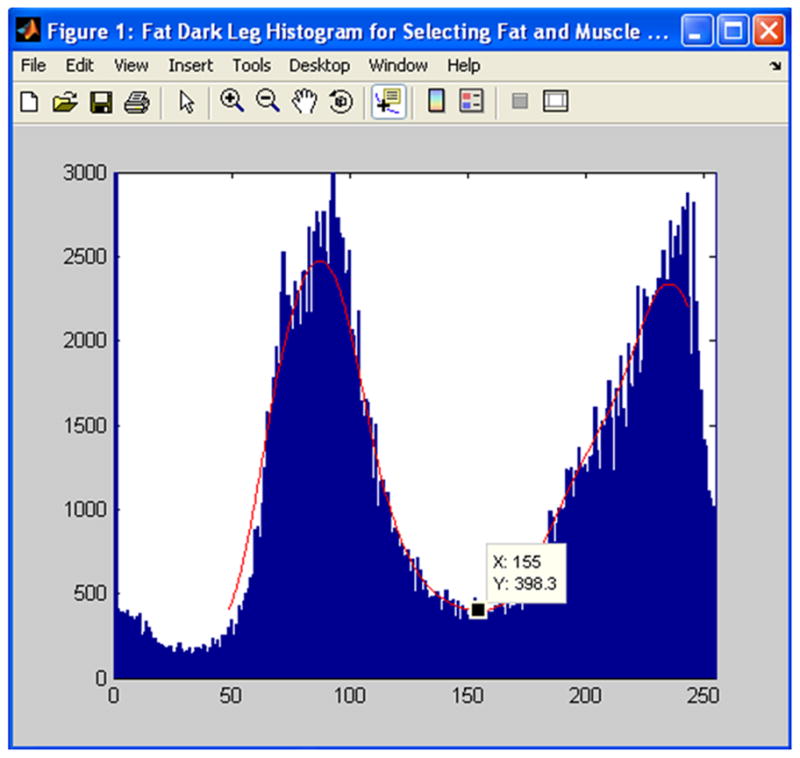
Figure 3.

A histogram of calf bone, adipose tissue and muscle is shown. The lowest point in the valley between the two peaks is automatically identified (black square, x=155). The program used this lowest point to find the individual muscle and IMAT volumes.
