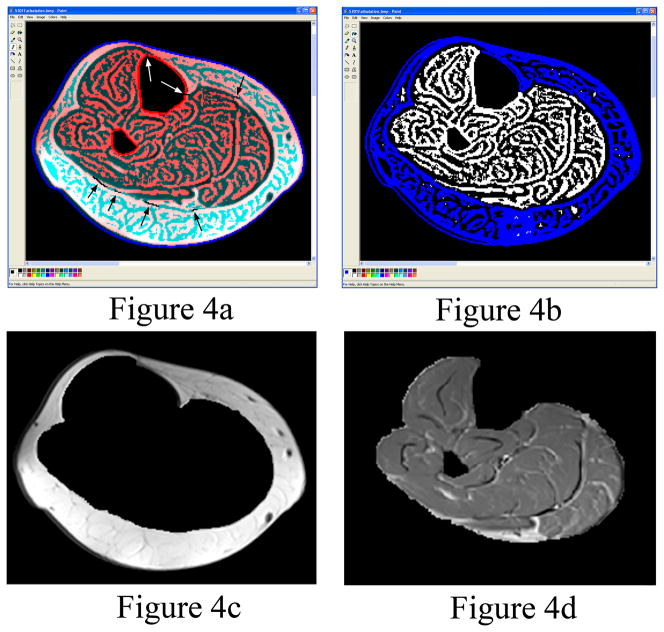
Figure 4.
(a) The internal edge of the subcutaneous adipose tissue is semi-automatically identified, but the user is required to break small connections (arrows) between the subcutaneous adipose tissue and IMAT using a Paint program. (b) A “Fill With Color” tool within Paint is used to automatically fill the region denoted as subcutaneous fat with the color blue. (c) Representative subcutaneous fat segmentation. (d) Representative muscle and IMAT segmentation. Figures 4c and 4d are automatically created using the filled blue colored region shown in figure 4b.

