
Fig. 2.
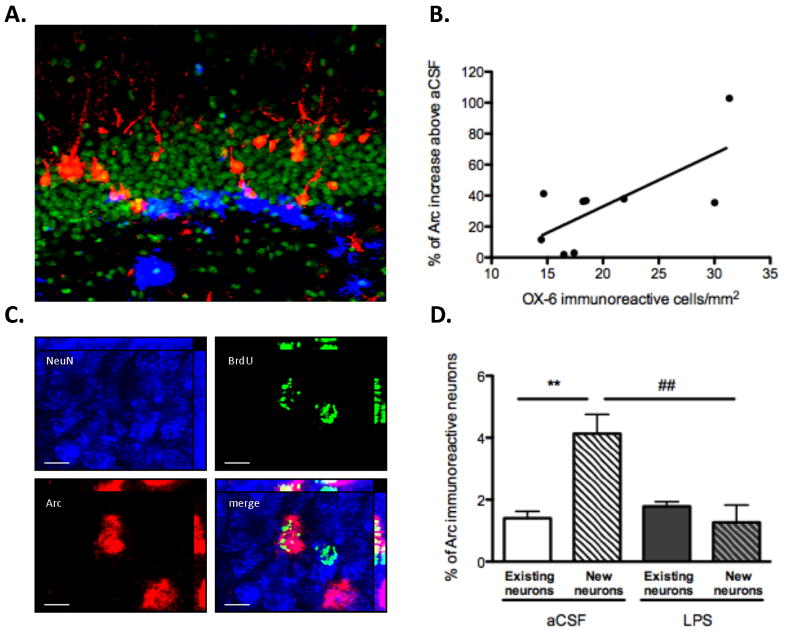
Impact of chronic neuroinflammation on the expression of behaviorally-induced Arc in existing and adult-born neurons measured two months after LPS infusion terminated. (A) Representative image of double immunofluorescence staining for activated microglia (OX-6 positive) (blue) and Arc protein (red) in the DG of an LPS-treated animal. Nuclei were counterstained with SYTOX Green. (B) There was a significant correlation between the density of activated microglia and the percentage increase of exploration-induced Arc in the DG of LPS-treated rats, above that of aCSF-treated rats (r=0.7063; p=0.0334). (C) Triple immunofluorescence staining for NeuN (Blue), BrdU (green) and Arc (red). The white arrow points to a triple-labeled cell (scale = 10 μm). (D) In aCSF-treated rats, the percentage of BrdU-labeled neurons expressing Arc was higher than the percentage of neurons that expressed Arc in the already existing population of granule cells (**p<0.01). In LPS-treated animals, the percentage of BrdU-labeled neurons expressing Arc was not significantly different than that of the already existing population of neurons. The proportion of BrdU-labeled neurons expressing Arc was significantly lower in LPS-treated animals than in aCSF-treated animals (##p<0.01).