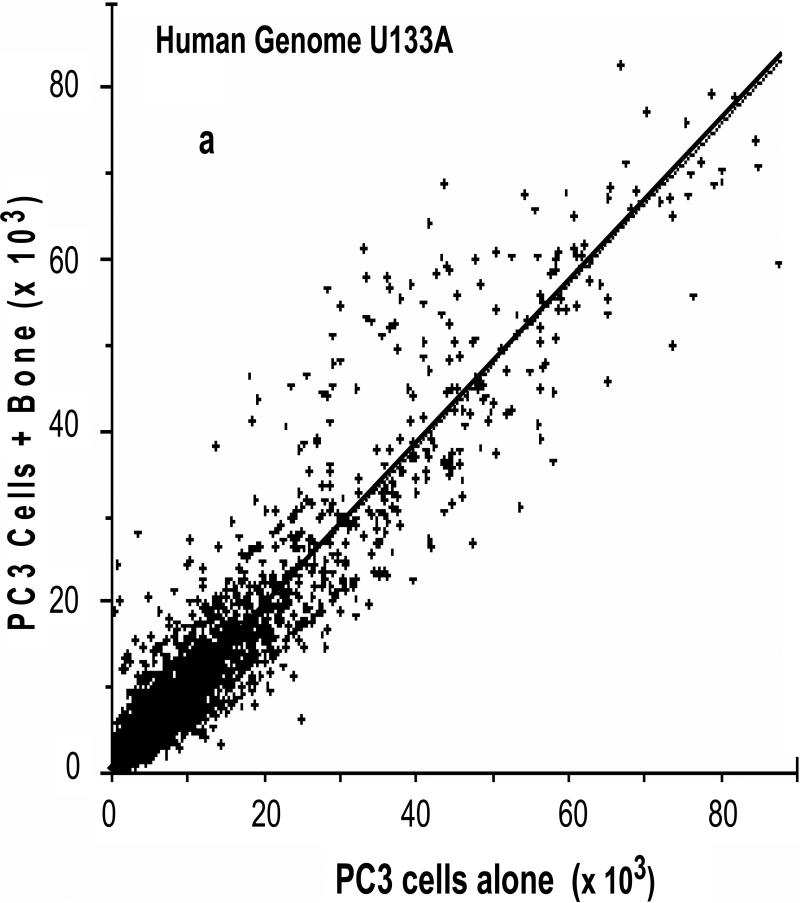
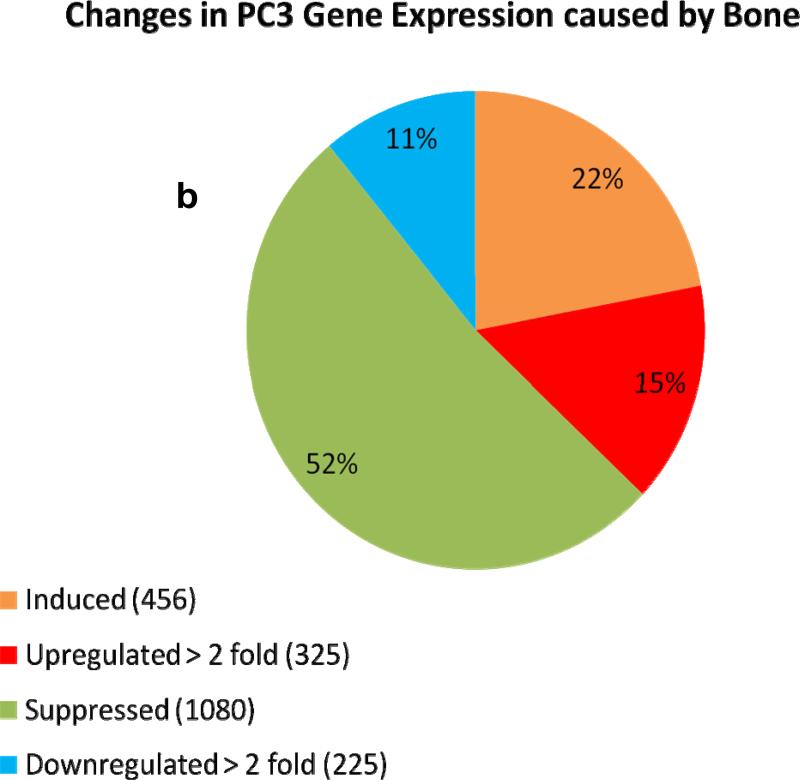
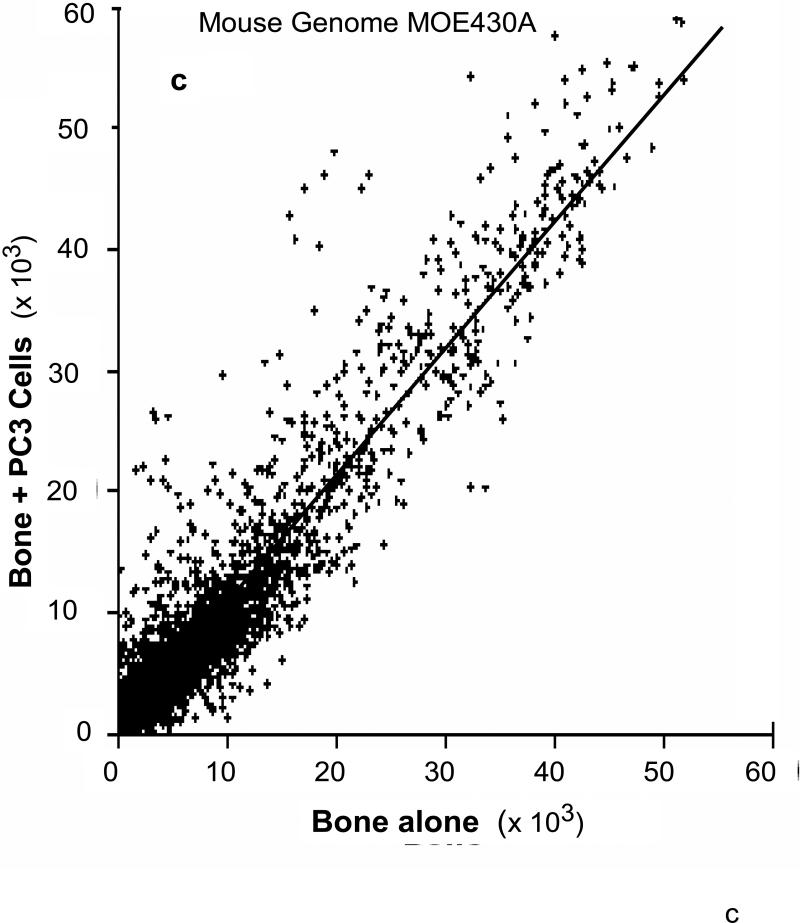
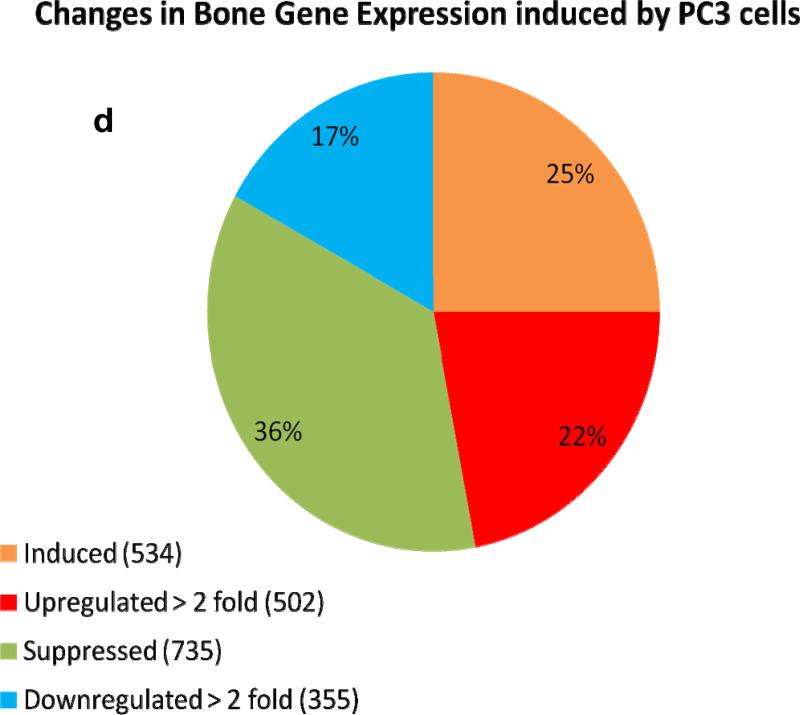
Figure 6. Human and mouse comprehensive gene microarrays for cancer-bone interactions.
(a) Plot of identified human genes in PC3 cancer cells grown with calvarial bone versus PC3 cells grown alone. Line slope of 1.0 and the data point distribution of each gene relative to findings in PC3 cells grown in the presence of calvarial bone versus PC3 cells grown alone. The data represents an average of total of four analyses, i.e., duplicate gene array analysis of duplicate experimental samples. (b) Venn diagram of the total number of human genes impacted in PC3 cells, up- or down regulated. (c) Plot of identified mouse genes in calvarial bones grown with PC3 cancer cells versus calvarial bone grown alone. Line slope of 1.0 and the data point distribution of each gene relative to findings in calvaria grown in the presence of PC3 cells versus calvaria grown alone. The data represents average of total four analyses, i.e., duplicate gene array analyses of duplicate experimental samples. (d) Venn diagram of the total number of genes impacted in mouse calvarial bones, up- or down regulated.


