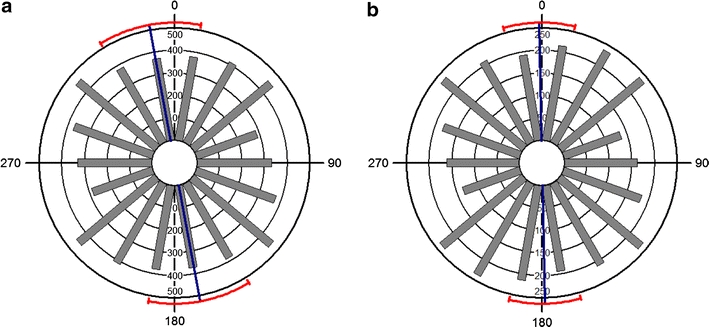
Fig. 1.

Circular histograms showing the distribution of body axes of individual cows measured by Hert et al. (2011) (a) total data set (mean axis 170°/350°, r = 0.032, Z = 3.49, p = 0.03, n = 3,437*), (b) subset Group II (mean axis 179°/359°, r = 0.064, Z = 7.269, p = 6.9 × 10⁻⁴, n = 1,801*). Blue and red lines indicate the mean axis and 95% confidence intervals for the mean axis, respectively. *The sample sizes indicated by Hert et al. (2001) do not match the number of axial data provided in their supplementary material. Copy and paste of the original data listed in the supplementary material resulted in a sample size difference of 25 cattle in subset Group II. Indication of the sample size for subset Group I did not differ from data set provided
