
Figure 4. Thrombopoietin and IL-11 levels in lean and DIO WT and KO mice.
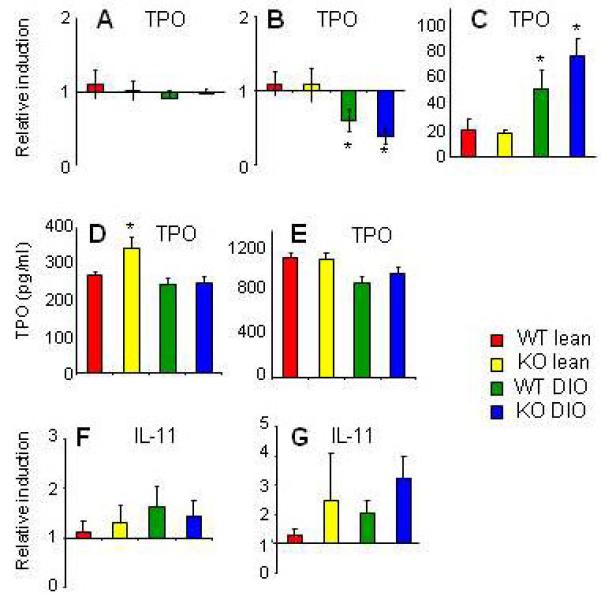
Expression of thrombopoietin (TPO) in liver (A) and VAT (B) and relative TPO levels in liver vs. VAT (C) were evaluated by real-time RT-PCR in lean WT (red), lean KO (yellow), DIO WT (green) and DIO KO (blue) mice. Plasma (D) and liver-associated (E) TPO levels (C) were evaluated by ELISA. Expression of IL-11 in liver (F) and VAT (G) was evaluated by real-time RT-PCR
Data are mean +/− SEM of 8-10 mice per group. Data in panels A, B, F and G are reported as gene expression relative to the WT lean group using the ΔΔct method. Data in panel C are reported as gene expression relative to the respective VAT value using the ΔΔct method.
^p<0.05 vs lean WT; *p<0.05 vs lean KO by ANOVA.