
Figure 6. Circulating SAA levels in lean and DIO WT and KO mice.
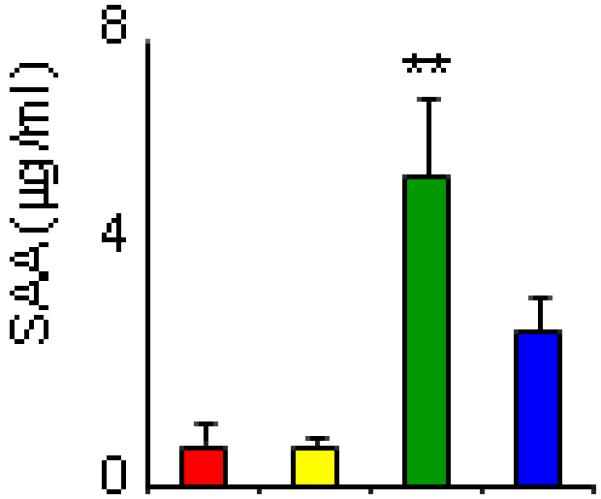
Circulating SAA levels were measured by ELISA in serum of of lean WT (red), lean KO (yellow), DIO WT (green) and DIO KO (blue) mice. Data are mean +/− SEM of 8-10 mice per group. **p<0.01 vs each other group by ANOVA.