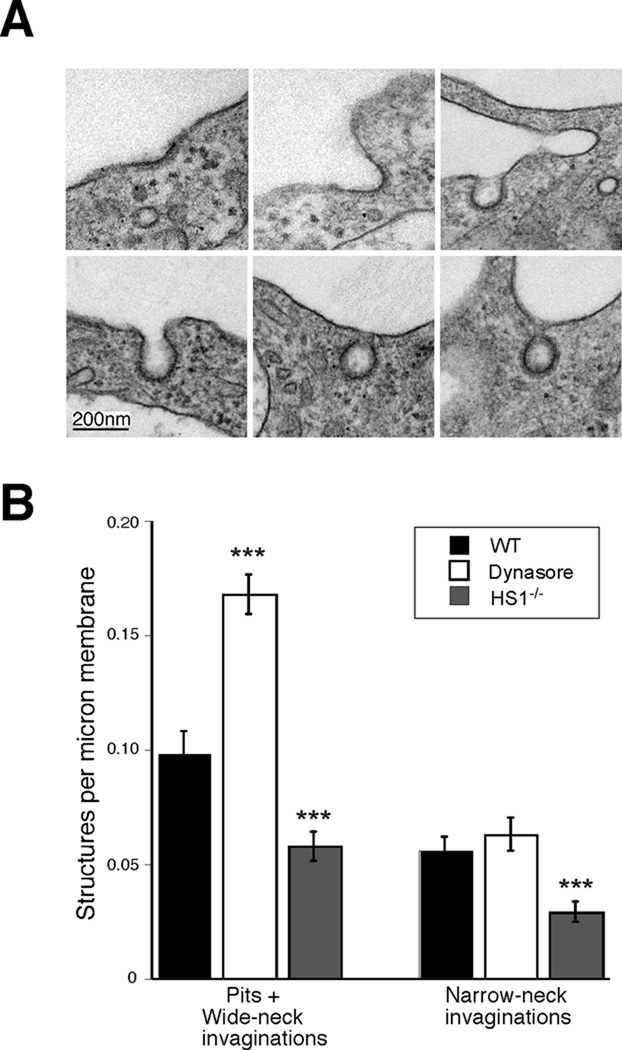
Figure 7. HS1 promotes endocytic invagination.
(A) Electron micrographs illustrating various stages in the process of the formation of forming coated vesicles. All images are from WT BMDCs; structures in HS1−/− BMDCs were comparable in morphology. Top row, examples of shallow pits and wide-necked invaginations. Bottom row, examples of narrow-neck invaginations. (B) Quantitation of the frequency of the structures shown in (A) in WT cells, WT cells treated with 80 µM dynasore and HS1−/− DCs. Cell profiles were photographed at random, and the number of structures in each category per linear micron of plasma membrane was determined as described in Materials and Methods. Values represent mean +/− SEM from 3–4 independent experiments, totaling 66–68 cells and 100–500 pits or invaginations per experimental condition. ***, p<0.001 relative to untreated WT cells.

