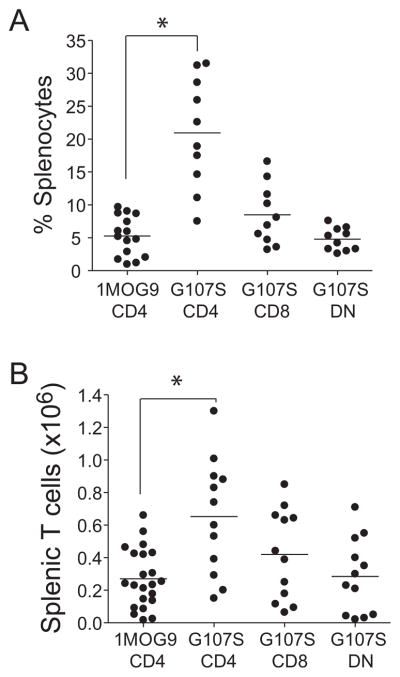
Figure 2. T cell subset engraftment in 1MOG9 and G107S mice.
Percent (A) and absolute numbers (B) of CD4+ (1MOG9 and G107S), CD8+ or DN (G107S only) T cell subsets from 7–12 wk 1MOG9 and G107S retrogenic mice are plotted. Circles indicate individual mice and lines population means. Substantial numbers of CD8+ and DN TCRB+ cells were not seen in the 1MOG9 mice. T-test comparison of CD4+ TCRB+ populations shows significantly increased relative (p=1×10⁻⁴) and absolute (p=2×10⁻⁴) engraftment in the G107S mice.

