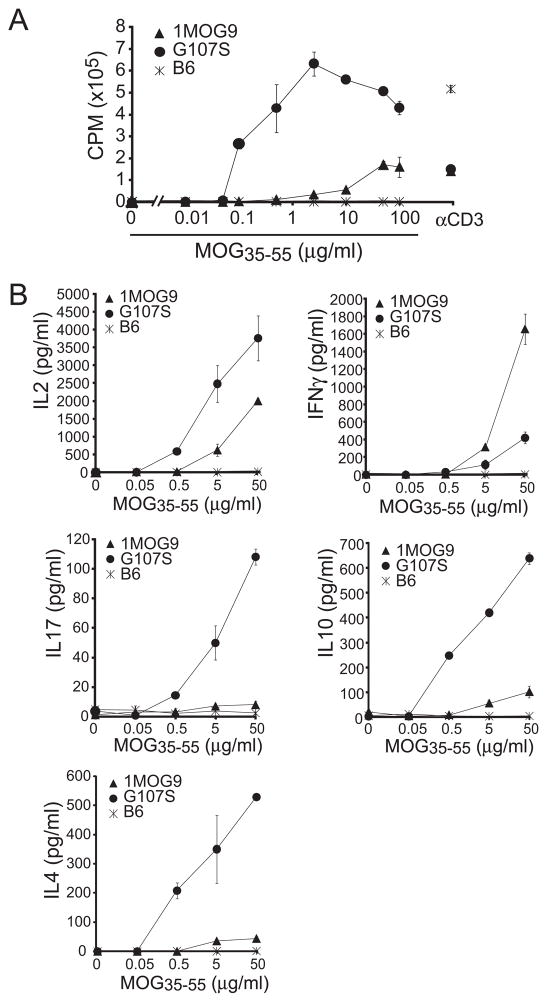
Figure 3. Proliferative response and cytokine profiles of 1MOG9 and G107S CD4+ T cells.
Splenic CD4+ T cells were isolated by magnetic bead selection from ~8 wk 1MOG9, G107S, or B6 splenocytes, and stimulated with the indicated concentration of Ag. (A) Proliferative response was determined by [3H]thymidine incorporation. (B) Stimulation-induced production of the indicated cytokines was measured using a bead multiplex assay. Mean ± 1 s.d. is plotted. Representative of 3 experiments.

