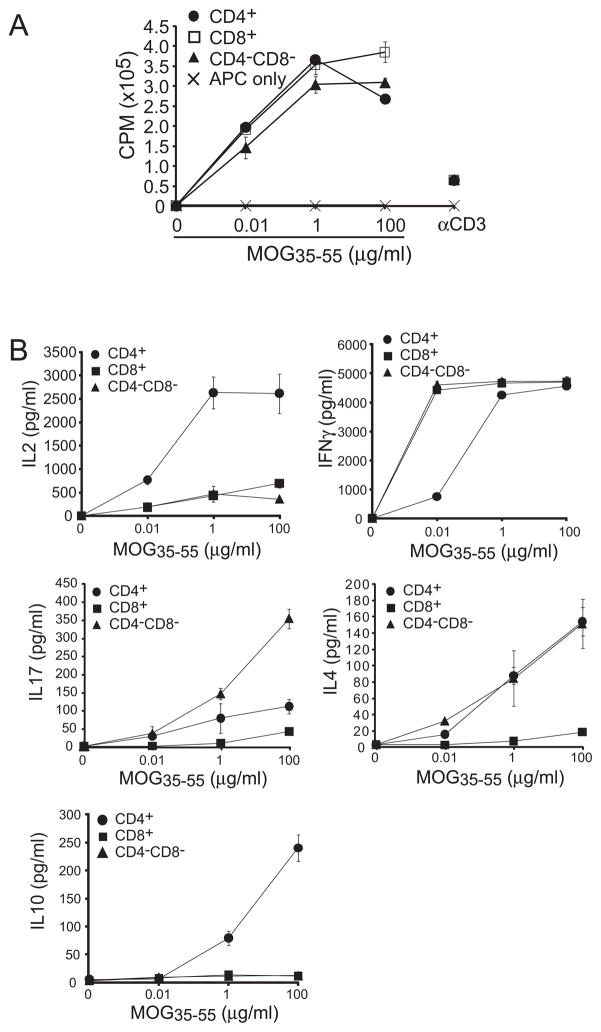
Figure 4. Comparison of proliferative and cytokine profiles of CD4, CD8, and DN G107S T cells.
Analyses were performed as in figure 3, except CD4+, CD8+, and DN TCRB+ T cells were isolated by flow cytometric sorting from 16 wk G107S mice. Use of older mice proved necessary to acquire adequate numbers of DN cells for analysis. (A) Proliferative response of T cell subsets or control irradiated APCs. (B) Cytokine production by T cell populations. Note that the increased production of IFNG by cells from the older mice compared with younger G107S mice (plotted in Fig. 3) was consistently observed. Mean ± 1 s.d. is plotted. Representative of 2 experiments.

