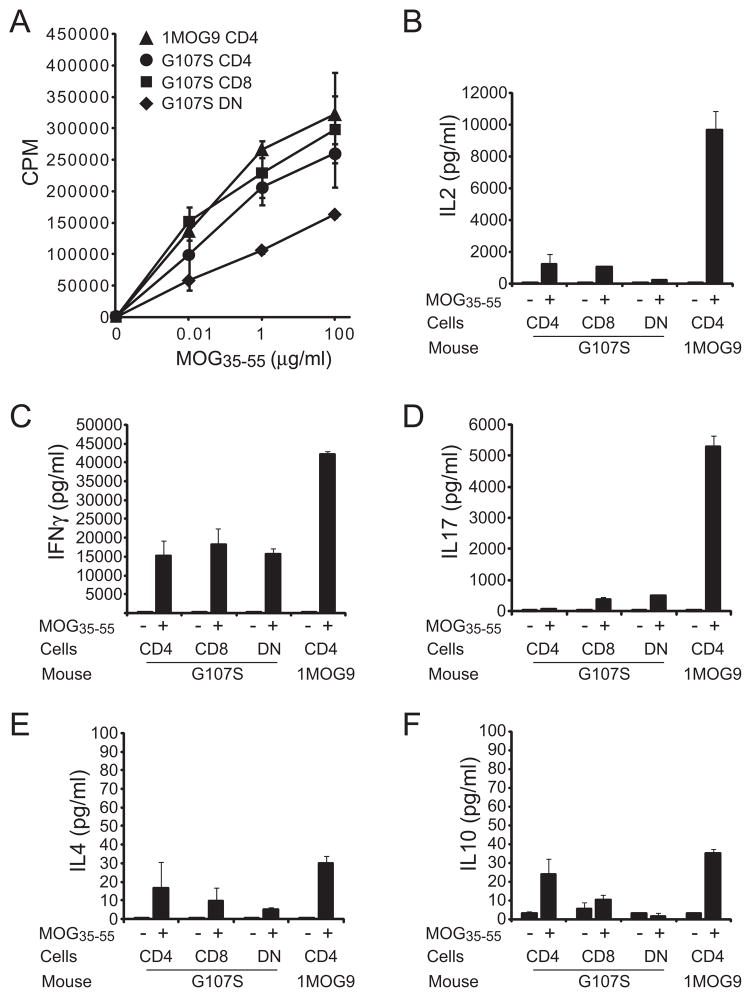
Figure 7. Functional profiles of 1MOG9 and G107S T cells in MOG-immunized mice.
T cell subsets were isolated by flow cytometry from 1MOG9 (CD4+) or G107S (CD4+, CD8+, DN) mice 7 d after MOG immunization. (A) Proliferation to the indicated concentration of MOG35–55 was measured by [3H] thymidine incorporation 72 h after stimulation. (B–F) Production of the indicated cytokines was measured by multiplex assay 48 h after stimulation. Responses of purified cells cultured without or with 100 μg/ml MOG35–55 is shown. Mean ± 1 s.d. is plotted. Representative of 2 experiments.

