
Figure 3.
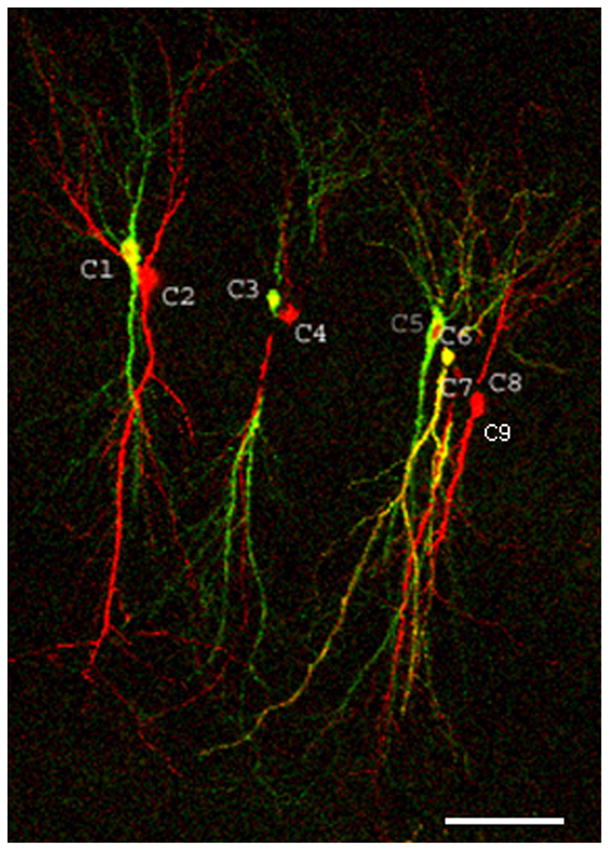
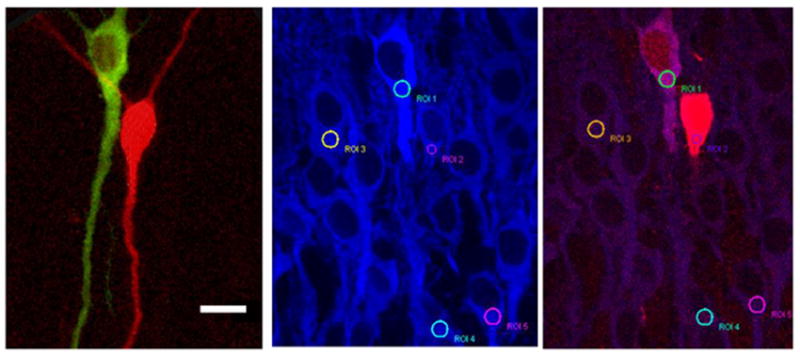
Measuring CaMKIIα immunostaining signal from thin slice sections. A, Low-magnification image of all nine cells expressing GFPCaMKII/RFP (yellowish) and RFP (red) in a single 30 μm thick section obtained from a fixed slice. The image is a maximal projection of Z stack green/red merged images; note that significant parts of cells 4, 7, and 8 were cut out of this section; Scale, 75 μm. B, Higher-magnification image of cells 1 and 2 (as numbered in A), Left panel – green/red overlapped image obtained from the live slice. Middle and right panels – same cell in fixed condition after labeling by anti-CaMKIIα/Alexa 405 antibodies (immunostaining -IS). Middle panel - CaMKIIα/Alexa 405 IS (blue); right panel - overlap of blue (IS) and red (mCherry) channels. Circles indicate ROIs for measuring IS signal in cell bodies. Note that the RFP expression was weaker in the cell that also expressed GFPCaMKII in comparison to the cell expressing only RFP.