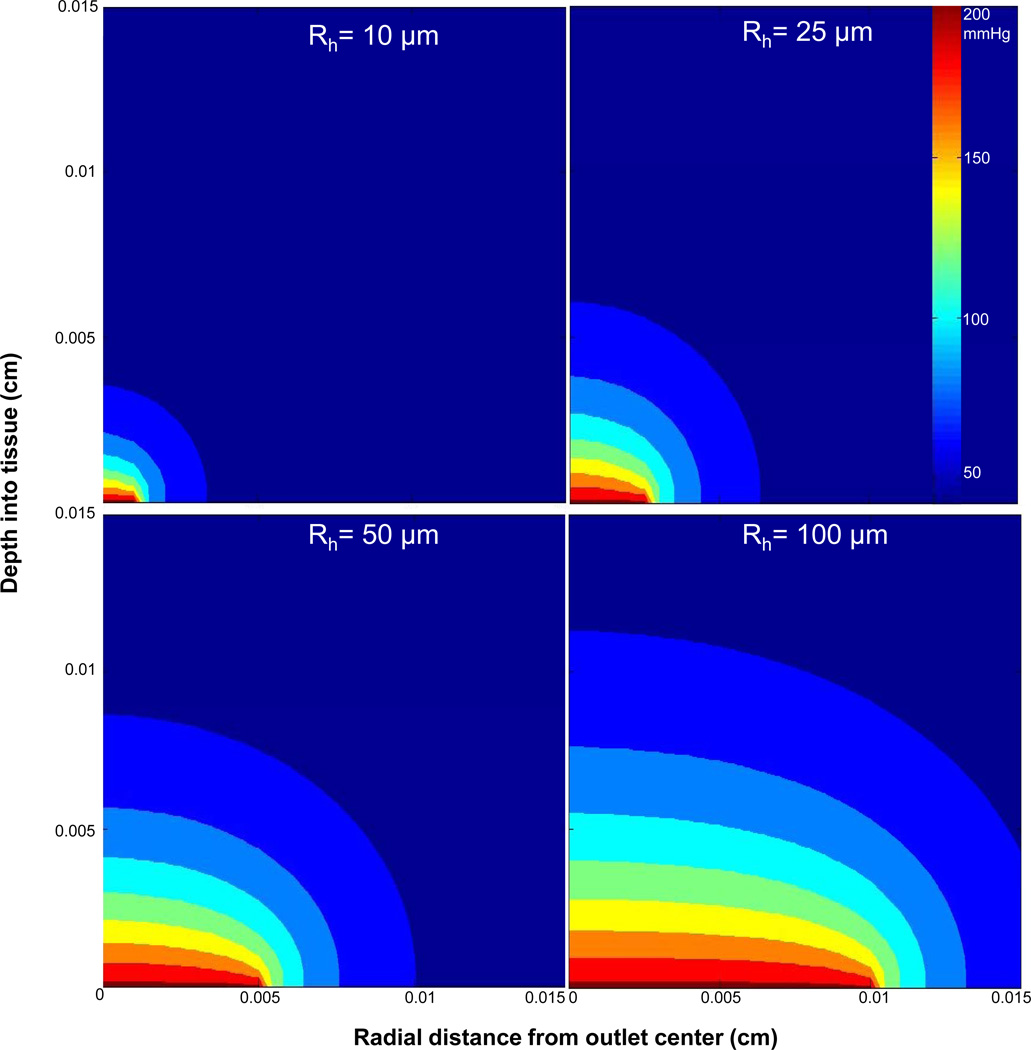
Figure 2.
Calculated PO2 distribution for oxygen delivery into live metabolic tissue through micro-outlets of various sizes (20 μm, 50 μm, 100 μm, and 200 μm in diameter). Using Pnorm(r,x) = (P(r,x)−P∞)/ (Poutlet − P∞) and a cut-off of Pnorm=0.25, the radius of lateral oxygen diffusion from the center of the micro-outlet is constant at ~150% of the radius while the depth of penetration increases with increasing outlet radius. The width of the tissue in this model (Rt) was set to 500 μm, however, the maximum value on the x-axis in the PO2 distribution plots was set to 150 μm. Computational modelling was conducted using algorithms written in MATLAB (Mathworks, Natick, MA).

