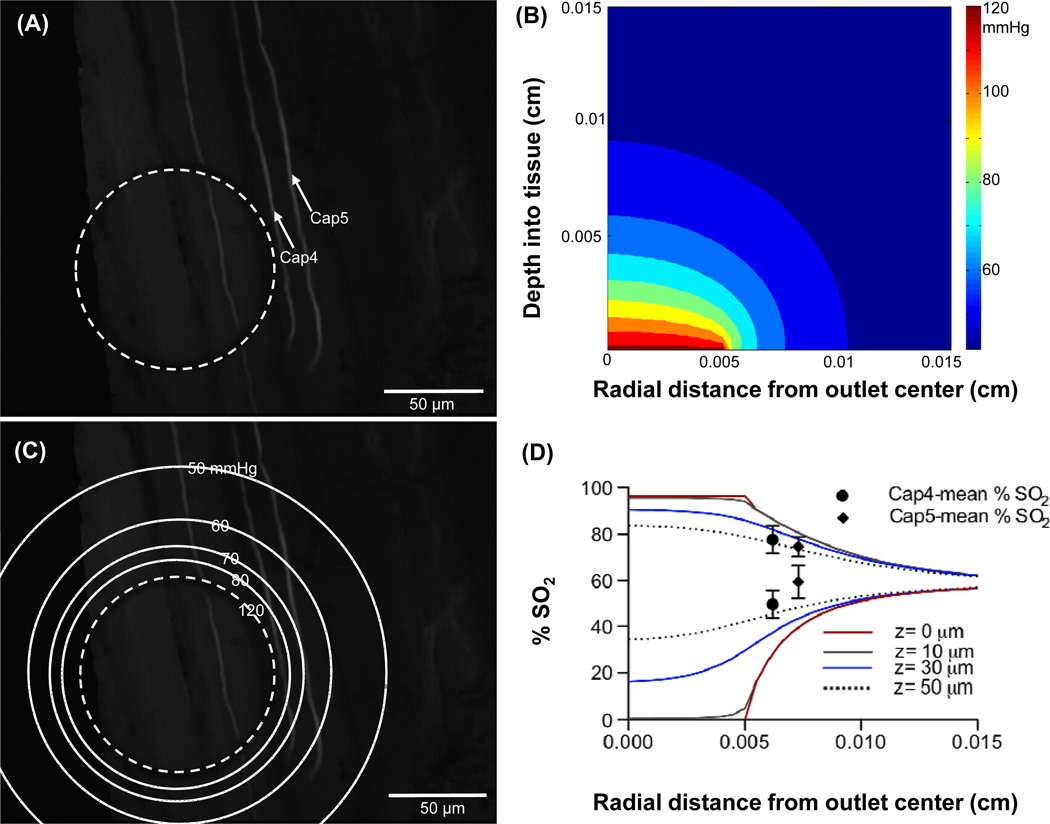
Figure 6.
Selected capillaries Cap4 and Cap5 shown in panel A were analyzed for RBC saturation changes as oxygen levels delivered through the micro-outlet were oscillated in a square wave. The PO2 level in the chamber was decreased from 16.2% (~123 mmHg) to 0.2% (~1.5 mmHg) for a 120 second hypoxic challenge and back to 16.2%. A six minute video sequence was captured beginning 2 minutes before the hypoxic challenge. The PO2 distribution profile into the tissue was modelled. Panel B shows 2D contour plot for a micro-outlet PO2 value of 123 mmHg. Panel C shows the surface (depth=0 cm) PO2 contour lines superimposed on top of the image showing the micro-outlet and the selected capillaries. The radial change in RBC O2 saturations at various depths into the tissue (z=0 μm, 10 μm, 30 μm, and 50 μm) were calculated from the modelled PO2 values using Hill’s equation then plotted against the radial distance from the center of the micro-outlet for a micro-outlet PO2 values of 123 mmHg (upper set of lines, panel D) and 1.5 mmHg (lower set of lines, panel D). Experimentally calculated SO2 mean values for Cap4 and Cap5 prior to and during hypoxia were plotted vs. capillary location (upper and lower pair of symbols respectively, panel D).

