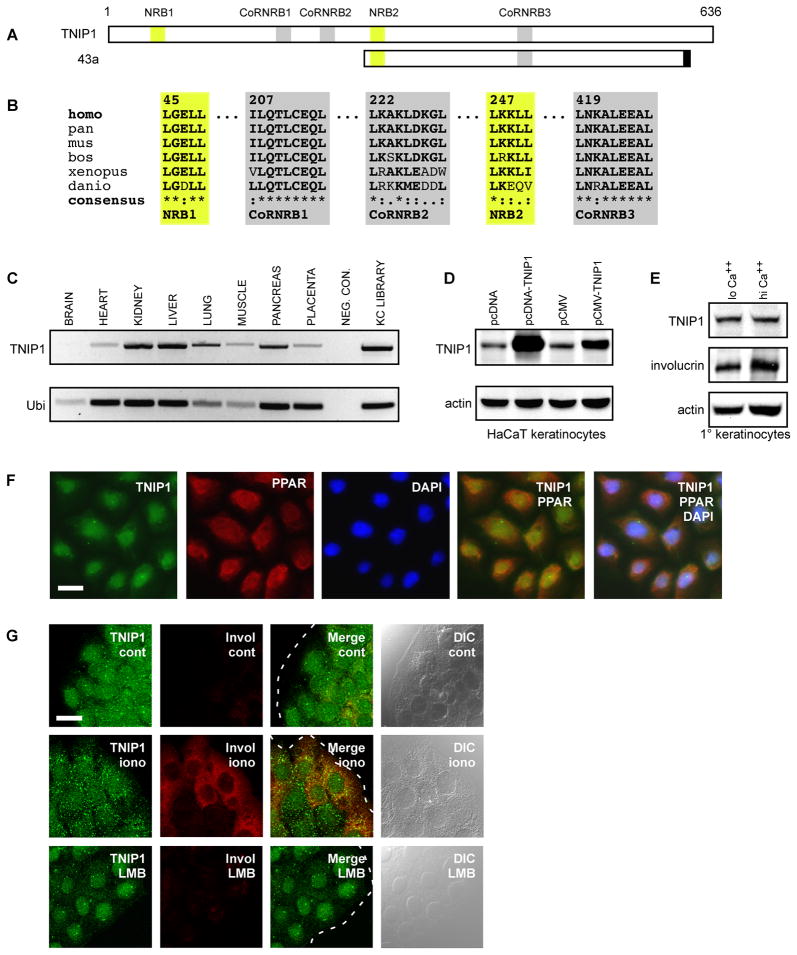
Fig. 1. TNIP1 NR coregulator motifs, tissue expression, and subcellular distribution in primary and HaCaT keratinocytes.
(A) Schematic of full-length TNIP1 protein, amino acids 1 – 636, with relative locations of candidate nuclear receptor boxes (NRB, yellow) and corepressor/nuclear receptor boxes (CoRNRB, grey) interaction regions. Clone 43a extended from amino acids 240 to 593 inclusive of the full-length TNIP1 protein and contained 17 nucleotides at its 3’ end (black box) coinciding with an exon border which may derive from alternative splicing [39].
(B) TNIP1 NR (LXXLL, yellow) and CoRNR box (L-XXX-I/L-XXX-L or hydrophobic substitution, grey) motifs are conserved across vertebrate species; amino acid numbering shown in top row follows the human sequence. GenBank records used were: NM_006058.3 Homo sapiens (human), XM_001167590 Pan troglodytes (chimpanzee), NM_021327 Mus musculus (mouse), NM_001024554 Bos taurus (cattle), NM_001079235 Xenopus tropicalis (frog), NM_001079952 Danio rerio (zebrafish). Consensus symbols are (*) amino acid identity; (:) amino acid conserved; (.) amino acid semi-conserved. Residues conserved across species compared to human sequence are bolded.
(C) TNIP1 detection from tissue-derived cDNA was compared against the ubiquitously expressed ubinuclein (Ubi) transcript. A weak TNIP1 band from brain, consistent with the weaker ubinuclein band, was observable in the gel. Neg. Con., negative control was water in place of cDNA. KC library, the cDNA library used in two-hybrid screen. Band sizes; TNIP1, 697bp; Ubi, 243bp.
(D) Top panel, detection of endogenous and recombinant TNIP1 protein. TNIP1 was detected in HaCaT keratinocyte RIPA lysates (25μg per lane) from cultures receiving empty pcDNA or pCMV expression vectors as control (first and third lanes, respectively). pcDNA or pCMV with human TNIP1 cDNA inserted (second and fourth lanes) increased band intensity at the ~85kD size. Bottom panel, actin signal as loading control from same blot.
(E) Detection of endogenous TNIP1 protein from human primary keratinocytes. The same blot was consecutively probed for TNIP1 (top panel), involucrin (middle panel), and actin (bottom panel) from RIPA lysates (20μg per lane) of keratinocyte cultures with final calcium levels of 0.1mM (lo Ca++) or 1.8mM (hi Ca++) for 48 h.
(F) TNIP1 colocalization with PPAR in human primary keratinocytes. Immunofluorescent microscopy of keratinocytes under low calcium conditions for TNIP1 (green), PPAR (red), and DAPI-stained nuclei (blue) with two-and three-channel merged images. Scale bar, 20μm. (G) Nuclear and cytoplasmic localization of endogenous TNIP1. Immunofluorescent confocal microscopy of HaCaT keratinocytes under control (cont), calcium ionophore (iono, 3μM A23187), or leptomycin B (LMB, 5nM) treatment conditions for detection of TNIP1 (green) or differentiation marker involucrin (red). Dashed white line (merged images) is colony edge. DIC, differential interference contrast. Scale bar, 20μm.

