
Figure 2. Stress induced stiffening in embryonic stem cells bound with ligand-coated beads.
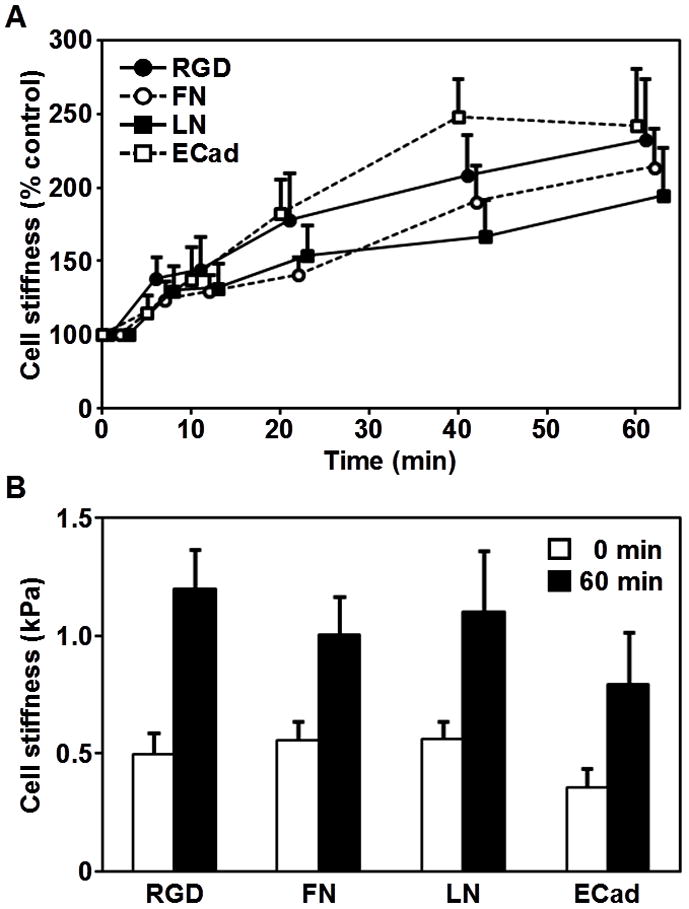
(A) Stiffening response is shown as a function of duration of stress application. The peak of cyclic stress is 17.5 Pa; the frequency of loading is 0.3 Hz. All stiffness measurements are normalized with respect to time zero. Means ± SE are shown. (B) Absolute magnitudes of cell stiffness (shear complex modulus) are shown before (0 minutes) and after (60 minutes) stress application. Each comparison of the cell stiffness before and after stress application showed significant differences; RGD, p < 0.012; fibronectin, p < 0.017; laminin, p < 0.041; and E-cadherin, p < 0.044. Data were collected from 5, 10, 9, and 7 cells for RGD, fibronectin (FN), laminin (LN), and E-cadherin (ECad) coated beads, respectively. Means ± SE are shown.