
Fig. 7.
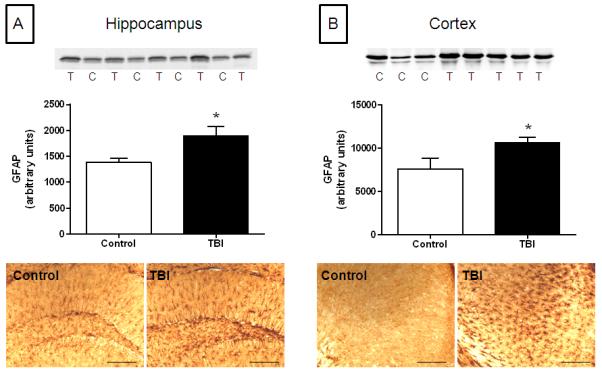
Effect of rmTBI on GFAP expression. Controls or mice exposed to 10 head impacts using the new method of rmTBI were analyzed for GFAP expression by immunoblotting (upper panels) or in 50 um fixed sections by immunohistochemistry (lower panels) in hippocampus (A) or cortex (B) 7 days after the last treatment. Each lane on the immunoblots represents individual control (C) or rmTBI-treated (T) mice. Data for the bar charts was derived from scans of immunoblots using ImageJ. The symbol * indicates a significant difference from control (p < 0.05). The calibration bar represents 50 um.