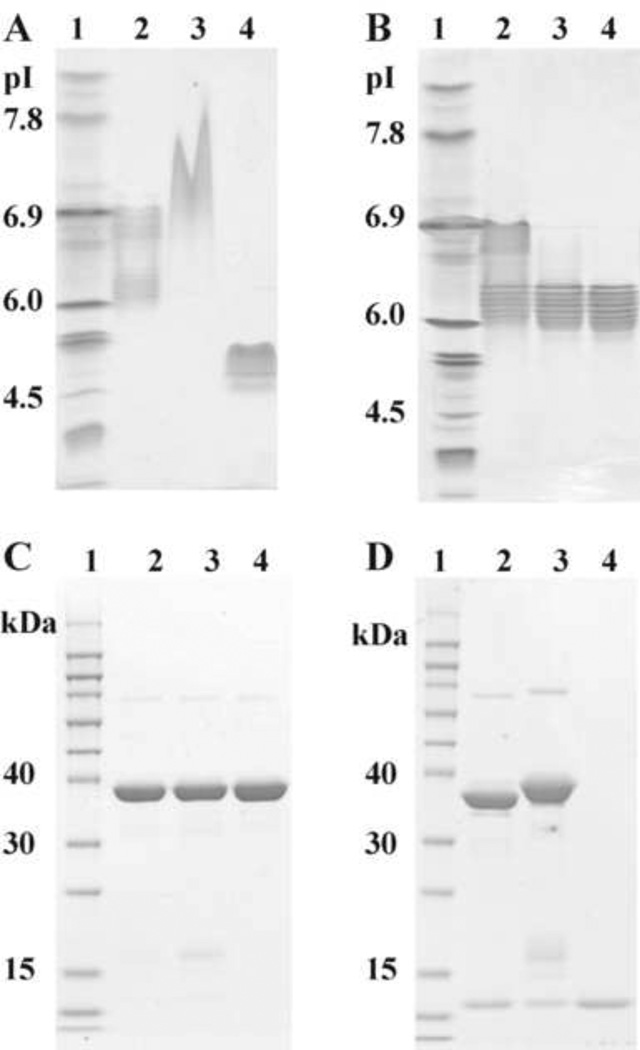
Fig. 2.
Gel electrophoresis profiles of IL-15N72D:IL-15RαSu/Fc preparations. (A) IEF pH 3–10 gel analysis. Lane 1, IEF Marker. Lane 2, IL-15N72D:IL-15RαSu/Fc complex purified by rProtein A column. Lane 3, IL-15RαSu/Fc. Lane 4, IL-15wt. (B) IEF pH3-10 gel analysis. Lane 1, IEF Marker. Lane 2, IL-15N72D:IL-15RαSu/Fc complex purified by Q step 1 elution. Lane 3, Q1c by Q step 2 elution. Lane 4, Q2c by Q step 2 elution. (C) SDS-PAGE (reduced) analysis. Lane 1, MW maker. Lane 2, IL-15N72D:IL-15RαSu/Fc complex purified by rProtein A column. Lane 3, IL-15N72D:IL-15RαSu/Fc (Q2c) by Q step 2 elution. Lane 4, IL-15RαSu/Fc (from Q flow through). (D) SDS-PAGE (reduced) analysis showing protein deglycosylation. Lane 1, MW markers. Lanes 2 and 3 show N-Glycosidase F digested and undigested IL-15N72D:IL-15RαSu/Fc protein, respectively. Lane 4, IL-15wt.

